

There is no long-term historical record of the Earth’s albedo, but over the past three decades there have a number of experiments designed to carefully measure this parameter and its spatial and temporal variability. From space, several instruments including ERBE, ScaRab, began to provide detailed albedo maps and various global measurements. With the launch of the CERES instruments, since 2000 a more systematic and precise monitoring has been possible. CERES measures the retroflection of each small area on the Earth twice a day, and interpolates to obtain the full albedo with bi-directional reflectance models. However, all space-based determinations rely on absolute measurements, which in the long run might be prone to instrumental drift.
A global and absolutely calibrated albedo can be determined by measuring the amount of sunlight reflected from the Earth and, in turn, back to the Earth from the dark portion of the face of the Moon (the “earthshine” or “ashen light”), as well as measuring the brightside ("moonshine") moonlight. For nearly two decades, we have been measuring the Earth's large-scale reflectance from BBSO right up to the present moment. The observations are now done remotely utilizing our earthshine coronagraph (Qiu, Goode, et al. JGR, 2003 for details of the instrumentation) under the small dome appearing to the right of the NST dome in the Figure 1. To get full coverage of the Earth, we have installed a carefully calibrated copy of the BBSO earthshine telescope in Tenerife (see Figure 2).
 |
 |
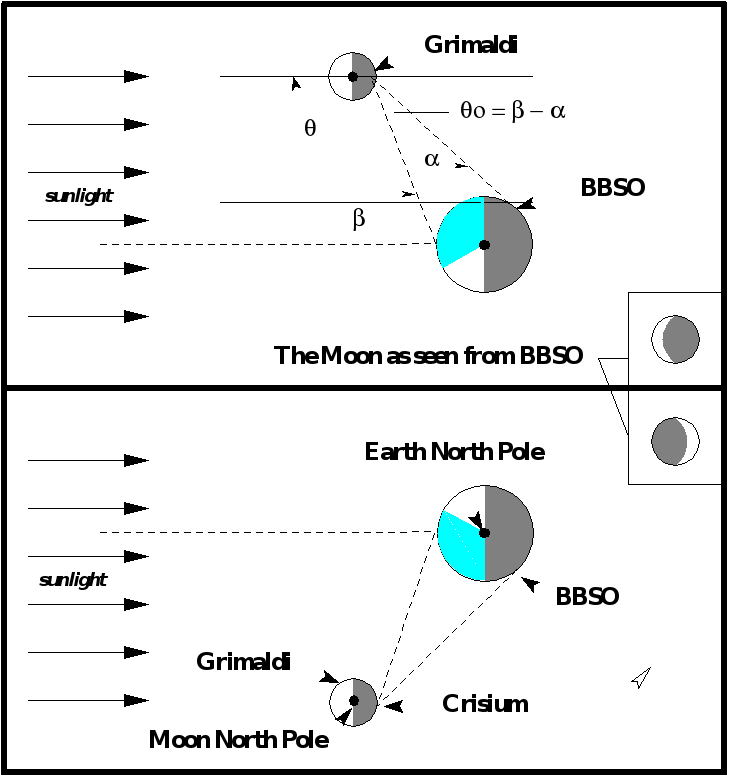
Figure 3 shows a not-to-scale cartoon of the sun-earth-moon system viewed from the pole of the earth’s orbit to illustrate earthshine observations. In both panels of Figure 3, the aspect of the moon as would be seen from BBSO is also indicated in a box, where the bright crescent is also called “moonshine”. Note how for positive lunar phases (top panel) the earthshine contribution comes from longitudes east of BBSO, while for negative phases (lower panel) it cones from longitudes west of BBSO. The collection and analysis of earthshine date are detailed in Qiu, Goode et al. (JGR, 2003) and Palle, Goode et al. (JGR, 2004).
 |
|
The albedo project is led in BBSO by Prof. Phil Goode and in the Canary Islands by Dr. Enric Palle. Below in Figure 4, we show the annual and decadal variations of this critical climate parameter from terrestrial measurements of the Earth’s albedo covering from December 1998 through December 2014 using observations of the earthshine. This is the first update since 2007, while the earthshine observations continue up to the present moment. The data from 2015 and 2016 will be analyzed in early 2017 after the latest two years are complete.
Between December 1998 and January 2007, earthshine observations were made from a telescope under the large dome in Big Bear. In 2005, a new small dome for earthshine was constructed near the large dome and a new, superior, small, automated earthshine telescope was constructed, installed and tested. From September 2006 through January 2007, both telescopes were run simultaneously for calibration purposes. The clearest ten nights covered a wide range of absolute lunar phase angles, |θ|, (70-140 degrees, see Figure 3) and showed an excellent agreement where the difference between the two apparent albedos for each night is nearly the same, small constant offset (independent of lunar phase). Then an identical automated earthshine telescope was built so that one of the twins would reside at our earthshine station in Tenerife. The twin telescopes were run side-by-side under the small dome in Big Bear between July and September 2007 with the fifteen clearest nights covering lunar phases between 80 and 150 degrees. Again, the difference between the two sets of data for each night could be accounted for by a single, but now appreciably smaller offset.
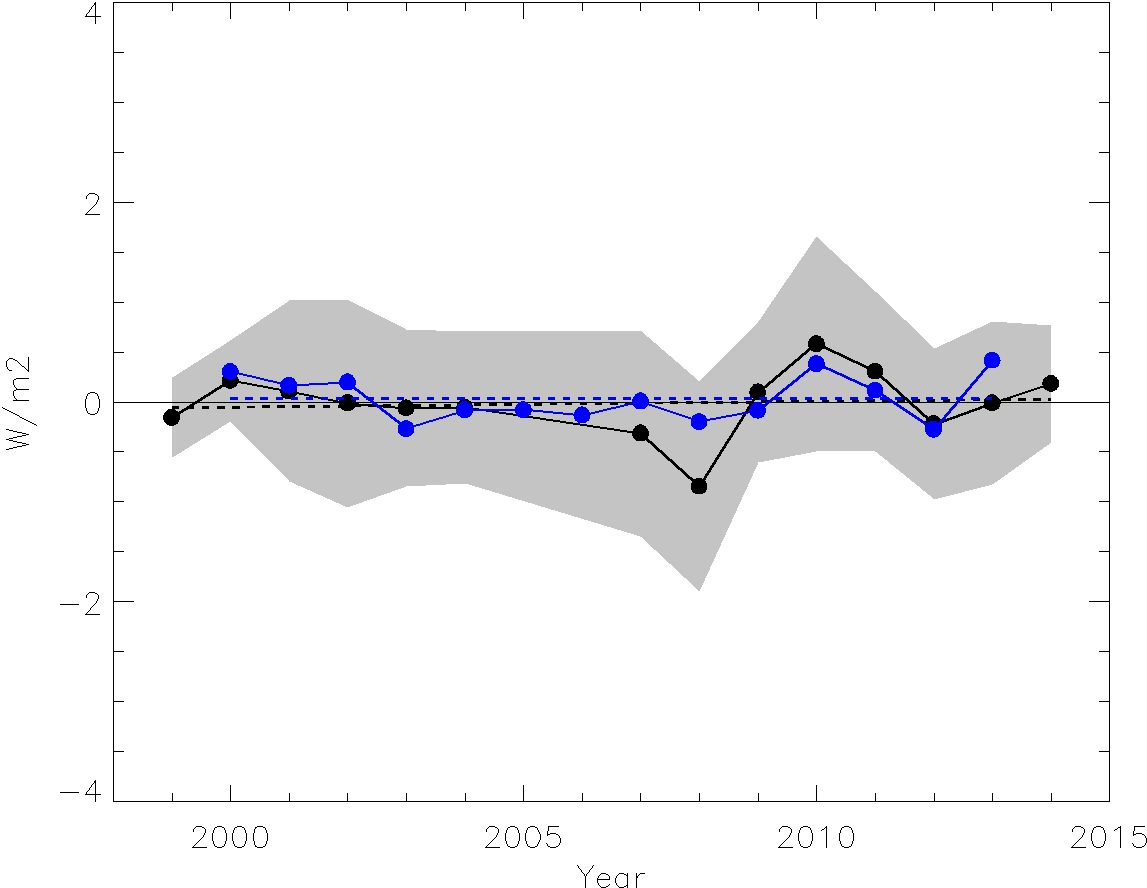
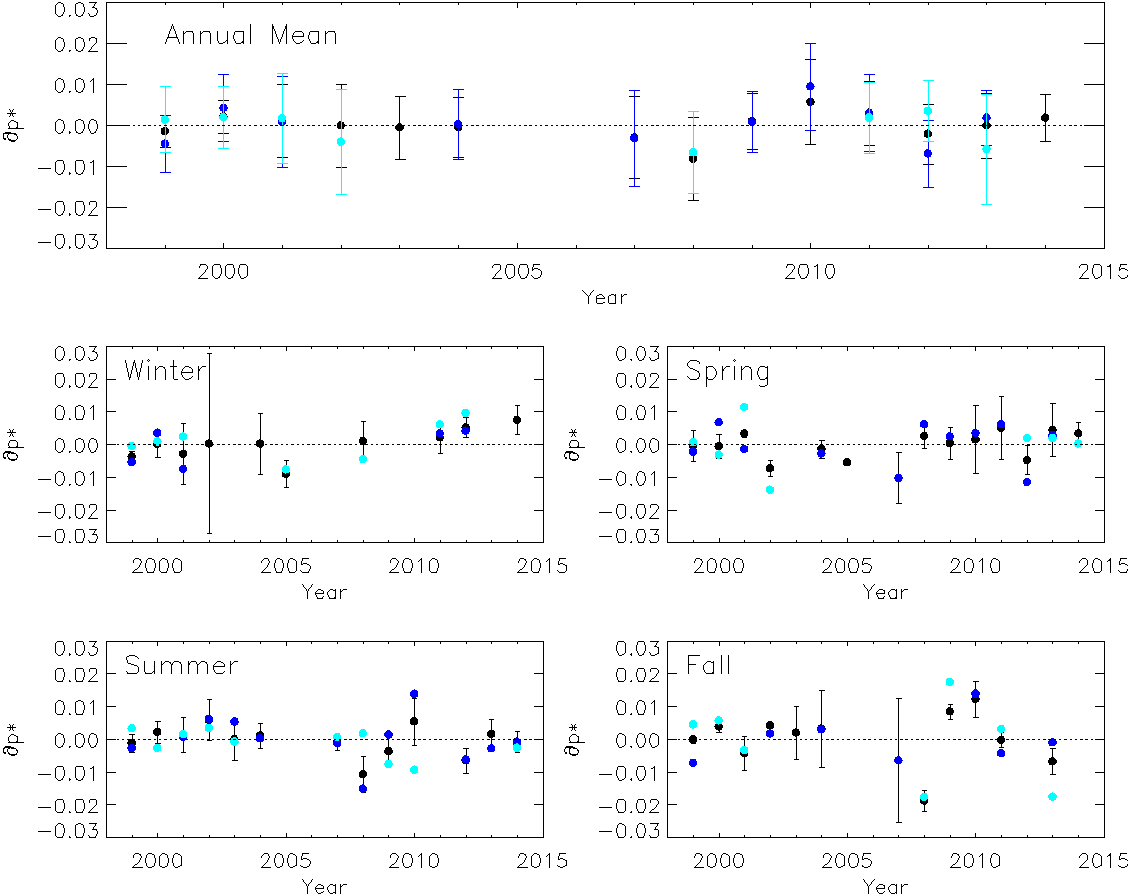
The earthshine annual albedo data points shown in Figure 4 result from an analysis of the BBSO data from late 1998 through the end of 2014 (see E. Palle, P.R. Goode, et al., 2016, GRL, 43, 453). We emphasize that not only do the earthshine and CERES albedo anomalies agree in magnitude over the common period, but they both show identical structures — both showing a slight decline for the first few years, both the robust dip in 2008, the robust peak in 2010 and turn up at the end of datasets. The agreement is even more impressive considering the distinctly different components of the Bond albedo to which each measurement is sensitive. The earthshine data in Figure 4 seem to show what may look like a random bump up and then down, but as shown in Figure 5, each year shows the same behavior for each of the four seasons, so the “bumps” are real and derive from something happening during the entirety of each year.
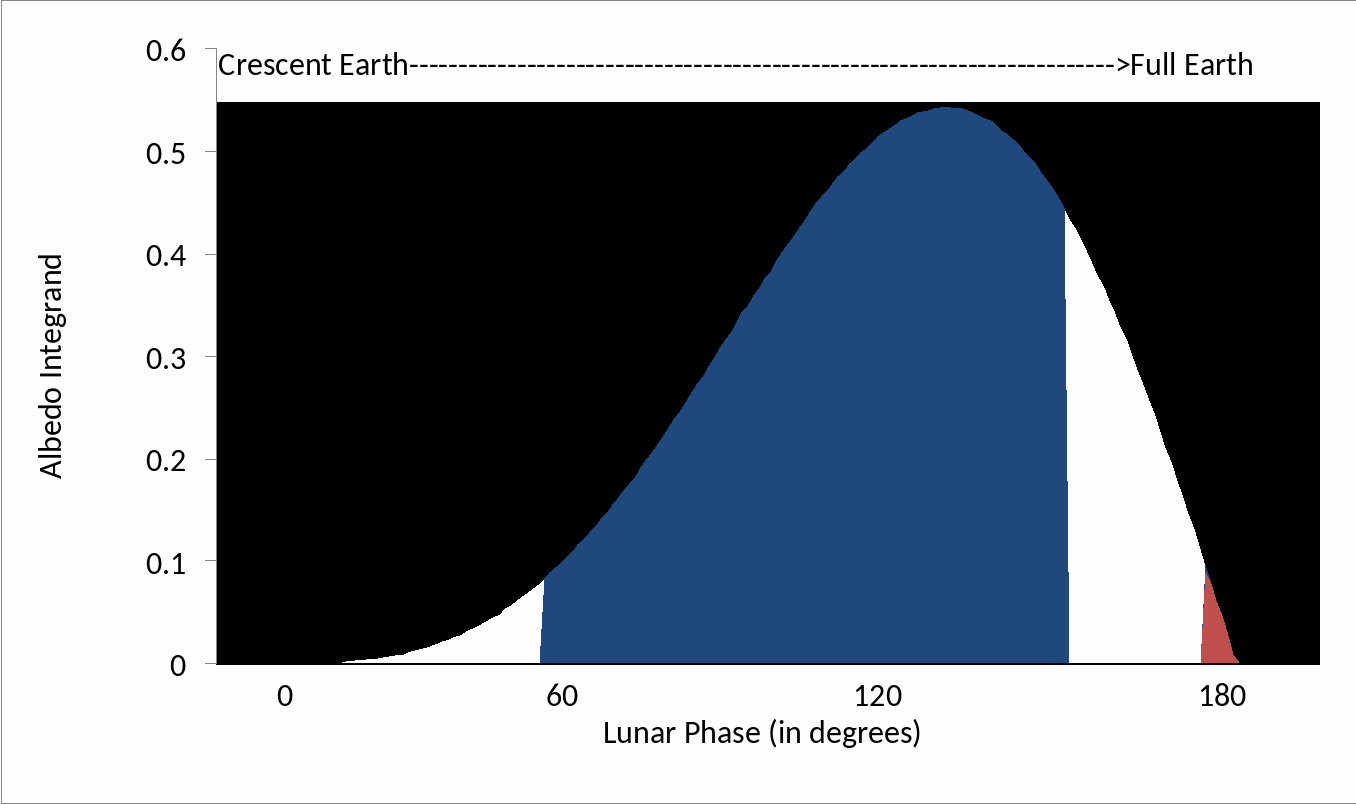
In earthshine nomenclature, CERES is sensitive to lunar phases of magnitude greater than 150 degrees, while earthshine is sensitive to phase angles of magnitude between 70 and 150 degrees, see Figure 6. In detail, CERES instruments fly in low-Earth polar orbit (LEO) satellites and, thus, are sensitive to light that is nearly retroflected at the TOA. To obtain the CERES Bond albedo one has to use bi-directional reflectances to model most of the contributions to the full Bond albedo. The phase angles measured by CERES plotted against the Bond albedo integrand are shown in Figure 6. In the same figure, one sees earthshine observations cover a distinct, but greater range of lunar phases, while they don’t have full Earth coverage and the data are much more sparse.
The most positive individual year is 2010 and the most negative anomaly is in 2008. These two years show no seasonal or geographical anomalies, but rather arise from some global phenomenon as do the anomalies in the other years. Both the black (blue) dashed lines in Figure 4 show no trend in albedo anomaly over the sixteen (fourteen) year data string.
In summary, in Wielicki et al (2005) reported a strong disagreement between earthshine and CERES albedo anomalies, over the initial, short period of 2000-2003. This disagreement was reduced when updated CERES albedo anomalies became available after their improved recalibration of the on-board sensors. With our new stricter clipping of the earthshine data, and extending the comparison to the full interval 2000-2013, the differences between CERES and Earthshine data have practically disappeared.
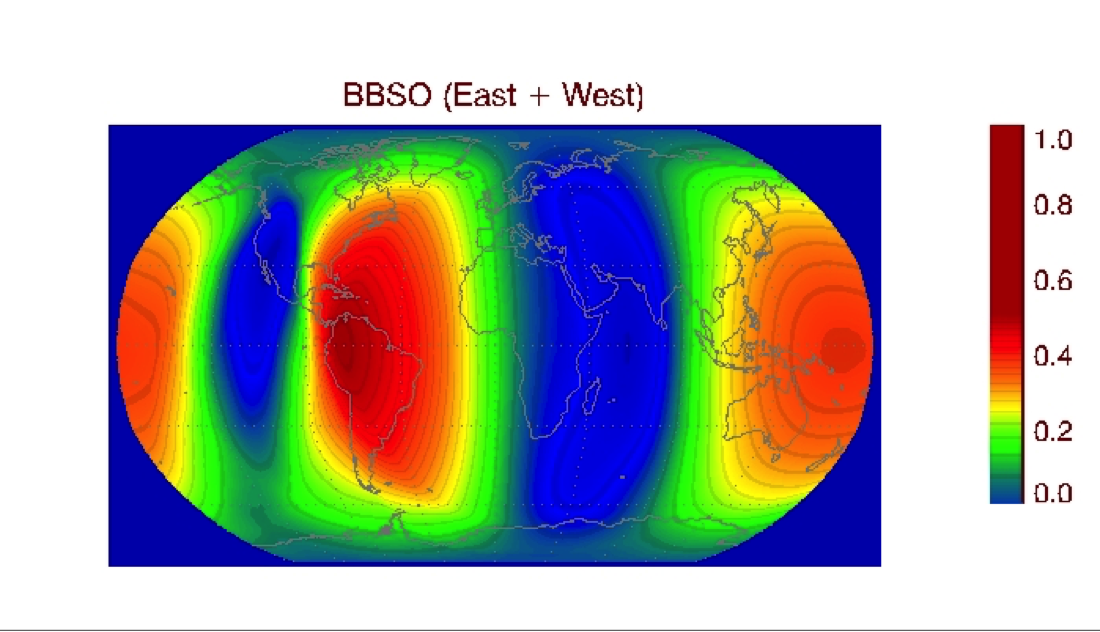
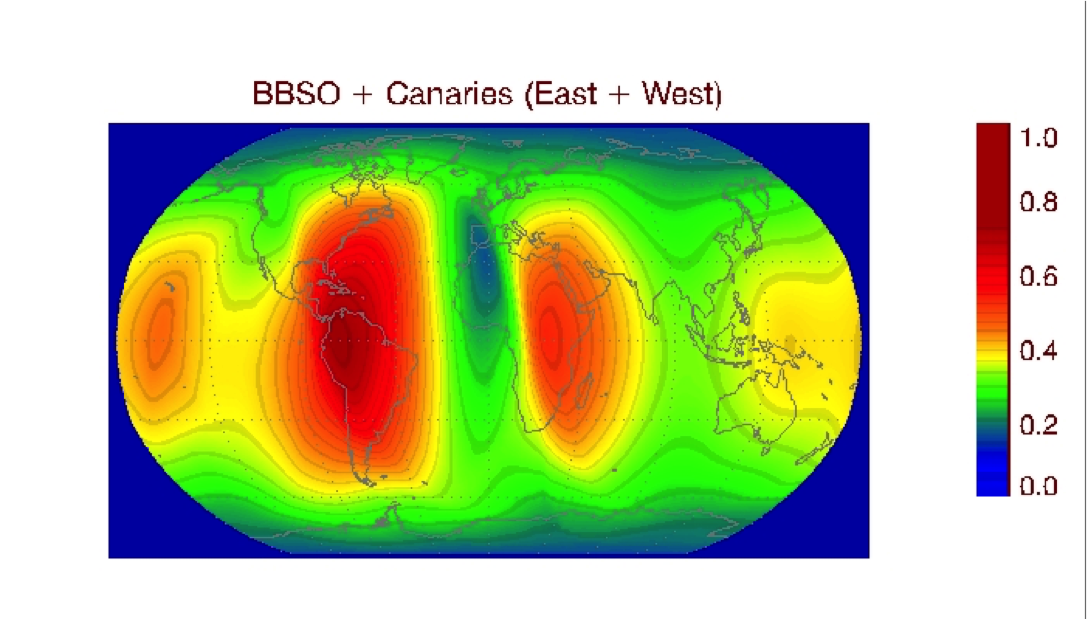
The data shown in Figures 4 and 5 come from BBSO, which only gives partial coverage of the earth, but data from BBSO and Tenerife gives something close to global coverage, which is what we are implementing (see Figure 7).
 |
 |
In the observations of the moon we were guided by the fiducial choices of Danjon a century ago, but we use more fiducial points, which are taken from the highlands near the lunar edge (see Figure 8 below).

Earthshine data show a weaker seasonal dependence than CERES data, which could bring the reliability of the earthshine measurements into question. However, the largest single source of the seasonal albedo variability observed in the CERES data is accounted for by the contributions from the North and South Poles. At any one time, only one of the two poles can be illuminated by the Sun, and when the illuminated polar area is larger, the earth’s albedo has a maximum, giving rise to the characteristic two-peak seasonal albedo cycle. In this sense, earthshine observations from our sites are insensitive to the polar regions because more weight is put in the tropical regions, and so are also insensitive to seasonal changes. Thus a seasonal cycle is not observed, but also not expected (there is no strong seasonal cycle in CERES tropical albedo measurements either).
Another incorrect criticism leveled against the earthshine data is that the geographic sampling varies each night. To illustrate, as the moon rises to full, each observing night is longer; however, less of the earth is covered at each moment. But at the end of the night, almost precisely the same area of the earth is covered for each night for a waxing (waning) moon. This is true night-after-night, month-after-month and even year-after-year (Palle et al., JGR, 2006), and illustrated for one month of observations in Fig. 9. In Palle et al. (JGR, 2009), we used models to how that longer term wanderings of the lunar orbit don’t have a significant impact on the albedo.

A series of missions will be launched over the next few decades that will be designed to detect and characterize extrasolar planets around nearby stars. These missions will search for habitable environments and signs of life (biosignatures) in planetary spectra. Vegetation’s “red edge,” an enhancement in the Earth’s spectrum near 700 nm when sunlight is reflected from greenery, is often suggested as a tool in the search for life on terrestrial-like extrasolar planets. We used ground-based observations of the Earth’s spectrum as seen in the earthshine, so that the Earth is unresolved, just as terrestrial-like extrasolar planets would be. We measured earthshine spectra from the 60” telescope on Palomar using its now decommissioned spectrograph, used satellite observations of earth’s clouds, and an advanced atmospheric radiative-transfer code, from which we determine the temporal evolution of the vegetation signature of the Earth. In particular, we find a strong correlation between the evolution of the spectral intensity of the red edge and changes in the cloud-free vegetated area of the Amazon over the course of observations (Montañés-Rodríguez et al., ApJ, 629, 2005, and ApJ 651, 544, 2006). Thus, we “discovered” Amazonia measuring the earthshine. This matters in the search for terrestrial-like extra-solar planets.
Earth’s Albedo Variations 1998-2014 as Measured from Ground-based Earthshine Observations, 2016, Palle, E., Goode, P.R., Montanes-Rodriguez, P., Shumko, A., Gonzales-Merino, B., Marinez-Lonbilla, C., Jimenez-Iberra, F., Shumko, S., Sanroma, E., Hulis, A., Miles-Paez, P., Murgas, F. Nowak, G., Koonin, S.E., GRL, , 43, 4531.
Automated observations of the earthshine, P.R. Goode, S, Shoumko, E. Palle, P. Montanes-Rodriguez, 2010, Advances in Astronomy, doi:10.1155/2010/963650..
The Lunar Terrestrial Observatory: Observing the Earth using photometers on the Moon's surface, 2009, E. Palle and P.R. Goode, Advances in Space Research, 43, 1083-1089.
Inter-annual variations in earth’s reflectance 1999-2007, E. Palle, P. Montanes-Rodriguez, P.R., Goode, 2009, Journal of Geophysical Research, 114, D00D03, doi:10.1029/2008JD010734.
Shortwave Forcing of the Earth’s Climate: Modern and Historical Variations in the Sun’s Irradiance and the Earth’s Reflectance, P.R.. Goode and E. Palle, 2007, J. Atm. and Sol.-Terr. Phys., 69, 1556.
Measurements of the Surface Brightness of the Earthshine with Applications to Calibrate Lunar Flashes, E. Palle, P. Montañés-Rodríguez, P.R. Goode, Astron.J, 2007, 134, 1145, 2007.
Seasonal and Inter-annual Trends in Earth’s Reflectance 1999-2004, E. Palle, P. Montañés-Rodríguez, P.R. Goode, 2006,Journal of Geophysical Research.
Vegetation Signature in the Observed Globally-integrated Spectrum of Earth: Modeling the Red Edge Strength Using Simultaneous Cloud Data and Applications for Extrasolar Planets, P. Montañés-Rodríguez, E. Palle, P.R. Goode and F.J. Martín-Torres, ApJ, 651, 544, 2006.
Can the Earth’s Albedo and Surface Temperatures Increase Together?, E. Pallé, P.R. Goode, P. Montañés-Rodríguez, S.E. Koonin, EOS, volume 87, num 4, 24 January 2006.
A Multi-Data Comparison of Shortwave Climate Forcing Changes, E. Pallé, P. Montañés-Rodriguez, P.R. Goode, S.E. Koonin, M. Wild and S. Casadio, 2005, Geophys. Res. Lett., v.32, iss. 21, p. 702.
Globally Integrated Measurements of the Earth’s Visible Spectral Albedo, P. Montañés-Rodriguez, E. Pallé, P.R. Goode, J. Hickey and S.E. Koonin, 2005, ApJ, 629, 1175.
Toward a Global Earthshine Network: First Results from Two Stations, E. Pallé, P.R. Goode, P. Montañés-Rodriguez, S.E. Koonin, V. Rumyantsev, 2005, Geophys. Res. Lett., v. 32, iss. 11, p. 803.
Changes in Earth’s Reflectance Over the Past Two Decades, E. Palle, P.R. Goode, P. Montanes-Rodriguez, and S.E. Koonin, 2004, Science, 304, 1299.
The Earthshine Spectrum, P. Montañés Rodriguez, E. Pallé, P.R. Goode, J. Hickey, J., Qiu, V. Yurchyshyn, M. -C. Chu, E. Kolbe, C.T. Brown, and S.E. Koonin, 2004, Advan.SpaceRes., 34, 293.
The Earthshine Project: Update on Photometric and Spectroscopic Measurements, E. Pallé, P. Montañés Rodriguez, P.R., Goode, J. Qiu, V. Yurchyshyn, J. Hickey, M.-C. Chu, E. Kolbe, C.T. Brown, and S.E. Koonin, 2004, Advan.SpaceRes., 34, 288.
Earthshine and the Earth’s Albedo: 1. Earthshine Observations and Measurements of the Lunar Phase Function for Accurate Measurements of the Earth’s Bond Albedo, J. Qiu, P.R. Goode, E. Pallé, V. Yurchyshyn, J. Hickey, P. Montañés Rodriguez, M.-C. Chu, E. Kolbe, C.T. Brown, and S.E. Koonin, 2003, J. Geophys. Res., Vol. 108, No. D22, 4709, ACL 12-1.
Earthshine and the Earth’s Albedo: 2. Observations and Simulations over 3 Years, E. Pallé, P.R. Goode, V. Yurchyshyn, J. Qiu, J. Hickey, P. Montañés Rodriguez, M.-C. Chu, E. Kolbe, C.T. Brown, and S.E. Koonin, 2003, J. Geophys. Res., Vol. 108, No. D22, 4710, ACL 13-1
Earthshine Observations of the Earth’s Reflectance, P.R. Goode, J. Qiu, V. Yurchyshyn, J. Hickey, M.-C. Chu, E. Kolbe, C.T. Brown and S.E. Koonin, 2001, Geophys. Res. Lett., 28, #9, 1671.