ANDERS JOHANNESSON and HAROLD ZIRIN
Big Bear Solar Observatory, California Institute of Technology, Pasadena, CA 91125, U.S.A.
Astrophysical Journal, 1996, Volume 471, pp. 510-520
Abstract. We measured the height of the solar chromosphere as a function of position angle on seven circumsolar sets of high spatial resolution H-alpha filtergrams obtained during 1994-1995. Typically 40 CCD frames were needed to cover the solar limb. We also measured the frequency of visible macrospicules along the limb as a function of position angle. Two different height measures based on the gradient of the limb profile are defined in the paper. They show variation with a pole-equator difference of about two arcsec, the poles being higher. In centerline H-alpha the derived height is typically 4300-4400 Km at the equator and just below 6000 Km at the solar poles with a true local scatter of 500 Km (rms). A slight increase in height is also seen above active regions. We see a similar but smaller height variation in the wing of H-alpha. We also measured the height difference between the chromosphere in centerline and the wing of H-alpha. The off-band (spicule) limb is always lower than the centerline limb by an average value of 500 Km (0.7 arcsec). Because of the self reversal of the chromospheric H-alpha line, the off-band chromosphere is twice as bright as the centerline. As a result, the gradient of the off-band limb profile is considerably steeper just above the photosphere. Thus the popular view that spicules rise above the chromosphere is incorrect, except insofar as the macrospicules are concerned. We find the latter much more frequent above at the pole than at the equator, confirming the result of Bohlin et al. (1975). The number of macrospicules near the pole reaches 20 per 150-arc sec, or about three per arc min2 on the disk, while we only count a few (sometimes none) near the equator. While we defer a serious study of the macrospicules to a later work, we can already state that these features are asymmetric in time, i.e., they are seen to go up but not come down. Comparison with Yohkoh soft X-ray data shows a high correlation between the enhanced chromospheric height, the macrospicule frequency, and the location of the polar coronal holes. This agrees with earlier measurements obtained in lower resolution and suggests a magnetic cause of the height difference, namely that the presence of a vertical magnetic field permits the jets to ascend higher.
Subject headings: Sun: magnetic fields - Sun: chromosphere
The height of the solar chromosphere, as defined either by the height of the H-alpha band or the gradient of the flash spectrum in optical or radio wavelengths, has been of interest for many years. The visible chromosphere obviously extends up to 5000 kilometers, a height at which an atmosphere in hydrostatic equilibrium would have disappeared. The problem is complicated by the apparent existence of several components: the spicule jets, which are clearly dynamic and not in equilibrium; a higher static component with a narrow line profile seen everywhere in H-alpha centerline, and coinciding in height with the radio flash spectrum; and finally the macrospicules, concentrated near the poles, and extending upward from 7000 to 20000 Km. These components extend far higher than expected from hydrostatic equilibrium. We try here to define the components and understand the structure of the chromosphere in terms of them. It is hard to understand why models are in use which turn into corona at 2000 Km. At present only the CICM model (Ewell et al. 1992) corresponds to what is actually observed.
Besides the complexity of structure, there is evidence for variation with heliographic latitude. Respighi (see Fracastoro 1948) noted the pole-equator height difference in 1861. Skylab data (Bohlin et al. 1975) revealed a third population, known as polar spicules or macrospicules, localized near the poles. They probably are the features Respighi saw. The Skylab HeII 304 images are particularly valuable because they show the coronal holes clearly on the same images on which the macrospicules can be measured up to 60" above the limb. These data show almost no brightness difference between the macrospicules and the chromosphere, so the temperatures must be similar. Usually the spicules appeared to flow along magnetic field lines, so it was thought that height variations might be due to magnetic field variation.
Fracastoro (1948) reported on a long series of visual measurements made at Arcetri using a spectrograph with a radial slit. He found not only a polar excess at sunspot minimum, but a disappearance of the effect as the cycle peaked. However, his limb heights are above 10 arc sec, and may well be influenced by the macrospicules. Lippincott (1957) found a 20-30% increase in the height of individual spicules in photographs by Dunn (1960), noting that the highest spicules occurred near the poles. None of these measurements distinguished between spicules, macrospicules and chromosphere. They were generally made with a broad filter or a spectrograph where the entire H-alpha line was examined. Rabin and Moore (1980) tried to measure the effect on low-resolution full-disk images, and could find no effect, except for a 4% step (0.3 arcsec) at the edge of polar coronal holes. It should be noted that the BBSO full-disk telescope they used had a solid Fabry-Perot with broad wings, so the data was contaminated by the wing of H-alpha.
In the present work we use high-resolution digital CCD images with a high dynamic range and a scale corresponding to a full-disk image of 7000 by 7000 pixels. We primarily measure the height of the chromosphere as a function of azimuth, as well as the height difference between centerline and wing. We also give count data for macrospicules as a function of azimuth.
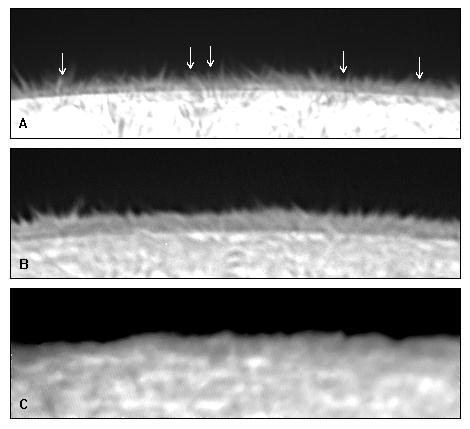
Since we measure the limb profiles of the chromosphere, we should discuss the nature of the observed profiles. Figure 1 shows important characteristics of the monochromatic chromosphere. Figure 1a shows a Zeiss (Lyot) filtergram at H-alpha-0.7 A in which the dominant features are spicules. Figure 1b shows the general chromosphere with the same filter, which has a narrower profile. The correspondence to magnetic features is not clearly defined, but it seems to be constituted of all the rapidly changing features inside the network cells. Figure 1c shows the H-alpha centerline image obtained with the Rakuljic (Rakuljic & Leyva 1993 ) holographic filter. The image through this pure filter does not show the spurious inner limb, which was shown by White and Simon (1966) to be due to continuum passing through the Lyot filter sidebands. However, on the Rakuljic image the limb may be discerned as the arc above which no bright network is seen. Above is the opaque wall of the lower chromosphere, falling off at greater heights. While a dark band appears just above the limb in the Lyot, the photometry shows it as a shelf. When we subtract the spurious limb, we see this as the lower chromosphere, an optically deep region with little falloff in brightness. There are also elevated bright regions with unknown photospheric counterparts. Off-band we see a much less regular chromosphere dominated by spicules, which does not extend as high. Unfortunately we could not use the Rakuljic filter for the entire project since in its present form it is not tunable and because of the difficulties of finding the photospheric limb.

Fig. 1. (a) An off-band chromospheric image. Several arrows mark the locations of dark and bright spicules crossing the limb. The spicule is brighter than the sky, but normally is in absorption against the disk, even near the extreme limb. (b) A centerline image at the same position angle but a few hours later showing the inner limb due to sidebands of the Zeiss (Lyot) filter. (c) A limb image on a different date with a pure filter (Rakuljic filter), with the inner limb barely detectable from the morphology.
The H-alpha spectrum is most interesting (Figure 2). The photospheric absorption line continues into the chromosphere without change, but bright emission horns of brightness equal to the photosphere appear at +/- 0.7A extending up to about 4000 Km. With good seeing, these break up into emission from individual spicules, extending to greater line shifts than the static chromosphere. At greater heights the horns disappear. The horns are also faintly seen in Figure 1 of White and Simon (1966).
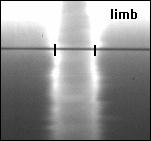
Fig. 2. Chromospheric H-alpha spectrum, with the slit at an angle of about 15 degrees to the limb, extending from the lower to the upper chromosphere. Bright emission horns about twice the brightness of the central core appear at either wing. The structures seen in the horns are due to the slit crossing several spicules.
Figure 3a shows plots of the limb brightness profiles in the filtergrams, using frames with the same exposure time in the various wavelengths. The solid line shows the continuum limb profile; the dotted line shows it in H-alpha-0.7A, and the dash is the H-alpha centerline profile. The last shows a shelf above the limb, corresponding to the dark band in Figure 1b; if we recognize that this is simply the step between the inner limb of sideband continuum and the pure chromosphere, we can subtract 12% of the continuum from the observed H-alpha image. That gives us the dot-dashed line profile, which corresponds well to the true centerline profile that we see with the Rakuljic filter (Figure 1c). The scattered skylight has been subtracted from all the profiles shown.
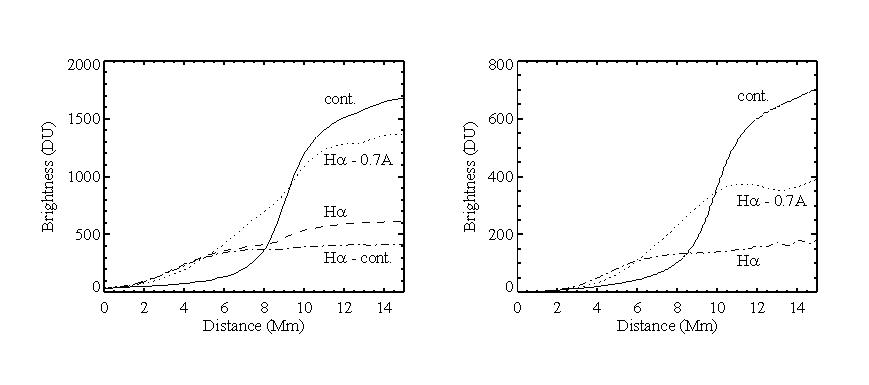
Fig. 3. Left: Limb profiles from three filtergrams obtained with our Zeiss filter in the continuum at H-alpha - 13.22A (solid line), at H-alpha - 0.7A (dotted line) and, at H-alpha (dashed line). All three images were obtained using the same exposure time and the scattered light has been subtracted. The dot-dashed line shows the effects of removing the spurious continuum from the centerline image and is similar to what one obtains with the Rakuljic filter. Right: Limb profiles obtained from a spectrum with a radial slit and a passband matching the Zeiss filter. The solid line shows the continuum at H-alpha -2A, the dotted line H-alpha -0.7A, and the dash dotted line H-alpha centerline. This confirms that the spectral horns are due to spicules and that the off-band chromosphere is about 500 Km (0.7 arcsec) lower than the on-band chromosphere.
In Figure 3b we show how these profiles may be recovered by tracing along the slit of a spectrogram with windows corresponding to the filter passband. The fact that the image at 0.7A shows spicules supports the idea that the horns are due to spicules not blocked by the general chromosphere.
The profiles in Figure 3 show that the off-band chromosphere is brighter than, but falls off more sharply than, the centerline profile. This confirms the impression of the well-known work of Dunn and Zirker (1973) that the off-band chromosphere is lower than the centerline.
It is most important to clarify this difference. Images in the wing of H-alpha show Doppler-shifted moving features in the chromosphere, namely spicules. Despite the evidence of the Dunn-Zirker images and various eclipse measurements, there is a general belief among solar physicists that the general chromosphere extends only to 2000 Km, as in the VAL model (Vernazza, Avrett & Loeser 1981). It is thought that the higher H-alpha emission is due to spicules. Our result establishes the qualitatively obvious fact that, except for macrospicules, the general chromosphere extends above the average spicules.
There has been little quantitative study of the height variation of the H-alpha line at the limb. One would think that eclipse measurements (Thomas & Athay 1961) should give a good measurement of the height of emission lines, but they are integral in nature. Information on brightness gradients must be derived by differentiation of noisy photographic data. In addition they only measure the two azimuths of second and third contact, and usually mix on-band and off-band together. Perusal of the actual eclipse data shows it to be useless for our purpose, generally saturated for H-alpha, and often with positive height gradients. The radio continuum data (Ewell et al. 1992) is particularly accurate and gives a scale height of 1000 Km for the electrons only.
The data used in this paper were obtained with the BBSO 65cm telescope, a Zeiss H-alpha filter of 0.25A bandwidth, and a digital CCD camera. The CCD contains 1024x1024 pixels but is used in a 2x2 binning mode to give a pixel resolution of 512x512 with 12 bits per pixel. The image scale was adjusted to about 0.3 arcsec per pixel, giving a field of view of 150x150 arcsec.
The great dynamic range of the camera (about 500:1) made possible measurement of the entire range from photosphere to the edge of the chromosphere. The filter sidebands pass the photospheric continuum, which permits a position reference. The high-resolution 12-bit digital images improve greatly on the previous results. In the large-scale samples around the limb the chromosphere is 20-25 pixels high. We measured 150,000 profiles, each of 100 pixels, on seven circumsolar scans and believe our data gives a reasonable representation of the chromosphere. We also took exposure sequences to learn if the apparent limb height was affected by exposure length (it was not), and determined and removed the scattered light.
Forty images were sufficient to cover the limb around the Sun. The computer-controlled guider completed these scans within 20 minutes. Our scans were made in both centerline (on-band) and wings (off-band) of H-alpha, the latter at H-alpha-0.7 A.
Since high atmospheric image quality is important for the measurements, we selected only the best data sets for analysis, five different days during 1994 and 1995. These are summarized in Table 1. The best data were obtained 1 August 1994.
| TABLE 1 | |||||
|---|---|---|---|---|---|
| Date | Number of Images | Exposure Time (ms) | Scale (arcsec per pix) | Wavelength (A) | Seeing |
| Aug. 01 94 | 38 | 118 | 0.29 | H-alpha | good |
| Aug. 03 94 | 39 | 118 | 0.29 | H-alpha | fair |
| Mar. 16 95 | 40 | 168 | 0.33 | H-alpha | good |
| Mar. 16 95 | 40 | 78 | 0.33 | H-alpha-0.7 | good |
| Jul. 05 95 | 36 | 168 | 0.37 | H-alpha | good |
| Jul. 05 95 | 37 | 118 | 0.37 | H-alpha-0.7 | good |
| Sep. 07 95 | 40 | 138 | 0.23 | H-alpha | fair |
For each data set we carefully measured the spatial image scale because the telescope scale was changing considerably. We do this by obtaining pairs of images with a shift of approximately one field of view, or about 150 arcsec. Structures are then compared utilizing digital cross-correlation techniques and the angular shift is given by the telescope encoders. The scale calibration is important since, combined with the angular size of the Sun, it gives us the apparent solar radius in pixel units. This is used in our limb fitting scheme described in the next section.
A critical step in the reductions is the detection of the photospheric limb, which is used to register the individual images to the solar coordinate system, and to form the reference for the height measurements. As mentioned above, the photosphere is visible in the filtergrams due to the sidebands of the filter. Its appearance is, however, sometimes obscured by chromospheric structures, which complicates accurate detection. We have considered two different detection techniques: one based on automatic digital image processing and a second based on interactive user input.
The automatic technique uses convolution with digital edge-detection kernels, which estimate the magnitude and direction of the edges in the images. The photospheric limb is clearly detected this way, but its signature is mixed with other edges that are due to chromospheric structures. To isolate the limb we numerically weight the pixels in the edge estimate by the square of the pixel values in the original image. We also digitally mask out the brighter part of the disk. The weighting suppresses structures in the fainter chromosphere outside the limb and the masking erases structures inside the limb. The mask is made by setting a brightness threshold in the original image, above which the image contains only structures inside the limb. This threshold is found separately for each image using the image histogram.
The interactive technique relies on the capabilities of the human brain to recognize patterns in a complicated image. The computer displays high-pass filtered versions of each image and reads two reference points on the limb from interactive mouse input. The original images are displayed with the result of the limb detection overlaid as graphics. This serves as a check of the detection.
Both techniques give an accurate detection of the limb, as is discussed below, but the automatic scheme is more sensitive to chromospheric structures like jets and filaments crossing the photospheric limb. The brain recognizes the difference between these and a smooth limb. We thus prefer the interactive method and have used that to produce the results in this paper. The result is repeatable to less than one pixel.
The problem of fitting to the limb is the same as that of finding the position of disk center for each image. For the interactive limb detection, the user supplies two points on the limb that are used to find the center of the disk. Since we have determined the solar radius from the scale calibration, we can mark the Sun center on the perpendicular bisector of the chord connecting the two points.
As a quality check, we use the calculated coordinates to put smaller versions of the input images together in a mosaic. This would immediately reveal large errors in the limb detection or the scale calibration. We could correct errors by using local cross correlation wherever the images overlap. A detail of one of our mosaic images is shown in Figure 4.
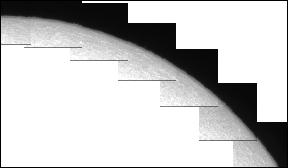
Fig. 4. A part of the set of images used to cover the limb on 16 March 1995. The images are here assembled into a mosaic according to the limb detections, as a test of the software.
Although our tests show that for clear sky conditions the apparent height of the H-alpha chromosphere does not depend much on the exposure length, judging the very gradual intersection of image with sky still is difficult. For purposes of relative height measurement we therefore measured the gradient of the brightness, which should be free of such problems and give a reasonable index of the height. However, the brightness profile is neither a straight line nor a regular curve, so we must consider carefully what is measured.
To clarify the correspondence between the limb profiles and the filtergrams we display a set side-by-side in Figure 5. The photospheric limb produced by the filter sidebands is seen at position A. Position B is the true H-alpha chromosphere, a shelf, or plateau about 3000 Km in extent where the chromosphere is optically thick. This appears in the Lyot images as a dark band just above the photosphere. The brightness difference between points B and A is the amount of continuum leak. At C the brightness gradient is almost linear, and at D the chromosphere is approaching the sky background.

Fig. 5. Center: an H-alpha centerline filtergram. Left: the same image after high-pass filtering. Right: the corresponding limb profile showing (A) the photospheric limb (marked on all three), (B) the centerline shelf, (C) the linear part of the profile, and (D) the sky background.
We define two different height measures based on the properties of this profile (Figures 6a and 6b). The first, which we call the e-fold measure, is simply the distance between the photospheric limb and a point with a brightness of only 1/e of the brightness at the shelf (feature B in Figure 5). The location of the plateau itself is not a good reference since it is hard to define its exact location. It is, however, wide enough to permit an accurate measurement of its brightness level. The second is the so-called slope measure (Rabin & Moore 1980), which uses a fit to the linear part of the profile (feature C in Figure 5). The height is then defined as the distance between the intersection of this line with the sky and the disk levels. Either of these can be defined as the "height of the H-alpha chromosphere." The disk level is for the slope measure defined as the brightness averaged over a ten arcsec wide interval just inside the photospheric limb.

Fig. 6. Definition of the height measures used in the paper. Top: The e-fold measure is defined as the distance between the photospheric limb and the point where the limb profile equals 1/e of the brightness of the shelf, shown by the solid vertical lines. (The brightness levels are shown by the dotted lines.) Bottom: The slope measure (Rabin & Moore 1980) is the distance between the intersections between a linear fit to the profile and the disk and the sky levels.
Figure 7 shows the results of the e-fold and the slope measures superposed on the same image. We see that the e-fold measure (top) corresponds closely to what we would select as the top of the chromosphere. The slope measure (middle) is more variable. The bottom image shows both measures superposed on a chromosphere which has been high-pass filtered in the radial direction. We have straightened the limb in each case. Both measures are repeatable and quite reliable in making an azimuthal measure. The scattered light is easily measured and removed.
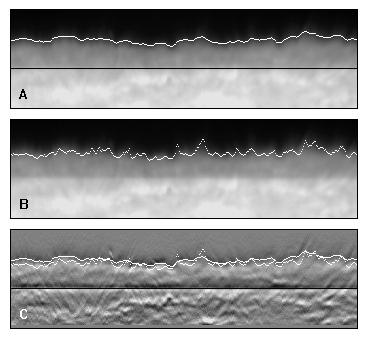
Fig. 7. Top: A centerline H-alpha image (with the limb straightened out) overplotted by the results of the e-fold measure. As can be seen in the image, the e-fold measure is giving a height close to what appears to be the height of the chromosphere by visual inspection. The black vertical line is the location of the photospheric limb. Middle: The same as above, but with the slope measure plotted. Lower: Both measures plotted on the same image (now high-pass filtered in the radial direction to show more details).
In our on-band data we measured the limb profile in closely spaced radial tracings separated by only one pixel. This obviously gives us a high angular resolution of the height measure with about 21000 measured profiles around the limb, but it also gives us a sensitivity to local fine structures, which will introduce a solar noise. The slope-measure is more sensitive to this than the e-fold measure. In Figure 8a and 8b we show these measurements both with full angular resolution and as a median over the extent of single images (about 150 arcsec). We use the median instead of the average to avoid the influence of sudden short jumps in height due to small-scale chromospheric structure. This is especially important for the slope-measure.
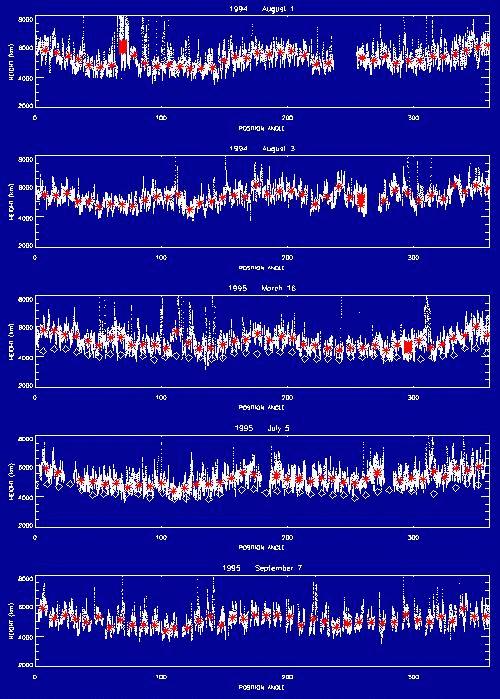
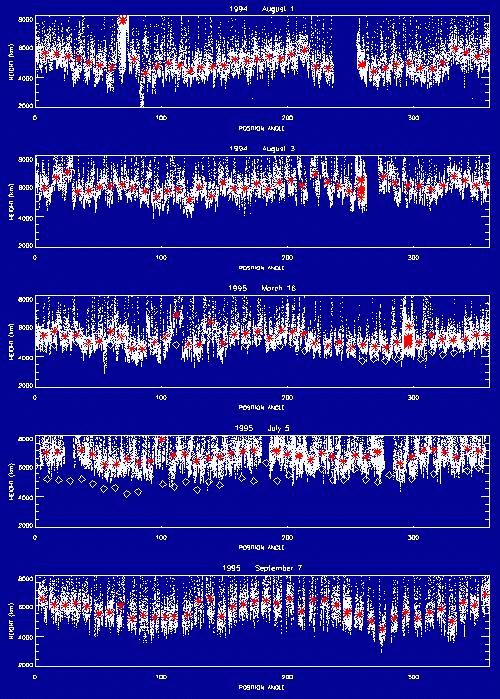
Fig. 8. The chromospheric height in centerline H-alpha for 5 days during 1994 and 1995 as a function of position angle, according to (a) the e-fold measure and (b) the slope measure. The black stars show the median value of the measurements within single images and the grey graphs show the individual measurements (typically 21000 around the limb). For two of the days (16 March 1995 and 5 July 1995) the diagrams also contain measurements made at H-alpha-0.7A (off-band), shown by diamonds. The off-band results for the slope measure are divided by two to fit the diagram, as discussed in the text.
Another technique we used to extract the limb profile was to average along azimuthal tracings at increasing radii. We did this for every integer radial pixel distance from well inside the photosperic limb to well above the chromosphere. The profiles produced this way were then used in the same way as the radial tracings described above to determine our two height measures. The azimuthal averaging is required for the off-band images, since the off-band limb is dominated by resolved spicules. It also gives a confirming measure in centerline.
To avoid problems due to the pixel raster, which will affect the results since we sometimes measure with an angle to the square pixels, we make the tracings at a subpixel level. For both the radial and the azimuthal tracings this means that we go in integer pixel steps even when we are measuring diagonal to the raster. The subpixel brightness values are found by bilinear interpolation (Press et al. 1992). The results of measurements using both techniques are plotted in Figures 8a and 8b. All scans showed peaks in the chromospheric height at the poles. The detailed results are given in section 5.
Although there is no shelf in the off-band data we chose to use the same two height measures as we defined for the on-band data. The reference for the e-fold measure is defined as the brightness three arcsec above the photospheric limb (which is where we measure the brightness of the shelf in the on-band data). The e-fold measures applied to the off-band data are thus estimating the gradient at the same distance from the photospheric limb off-band as on-band.
Due to the dominance of spicules in the off-band data we are only using the azimuthally averaged profile from each image, and thus make only one measurement per image. Our off-band data are limited to two of the five observing days (16 March 1995 and 5 July 1995). These measures are not really adequate to compare the on- and off-band heights, since the limb profiles are quite different. Nevertheless, they are quite reliable for measurement of the relative height around the limb.
To be able more clearly to see the spicules and other structures at the limb and on the disk, we processed some of our images. With a high-pass filter with a low frequency cutoff at about 0.1 cycles per pixel we see spicules and macrospicules at the limb and on the disk at the same time. On these images we can see individual spicules crossing the photospheric limb, a subject of old controversy.
We used the high pass filter to count the number of macrospicules around the limb in our on- and off-band data sets. The counts were made by visual recognition, aided by a computer program that presents the images and provides a drawn circle at the height above which the spicules are to be counted. The program also normalizes the counts to an interval of 150 arcsec even if the scale varies. In each case we had several people count independently, and found the results in agreement. The data, discussed below, confirm the Bohlin et al. (1975) result that the macrospicules are confined to the coronal holes. We defined the macrospicule as a jetlike feature extending above 7000 Km.
We have also used the high pass filtering to make movies of time sequences of spicule images. In those we see that the apparent motion within most macrospicules/spicules is upwards even though some features are seen to move downwards. These are, however, only preliminary results, and await more detailed analysis.
The results for the e-fold and slope measures are shown inFigures 8a and 8b respectively. In the figures, the median values of the radial tracing measurements made in the individual images are shown as black stars while the individual measurements are shown in grey. The measurements made in the azimuthally averaged profiles are not shown for the on-band data, since they are almost identical to the median values of the radial tracings.
The plots of the individual measurements show the true variations within images. This variation is much larger for the slope measure than for the e-fold measure. This is because the slope measure is about a factor of two more sensitive to the changes in the gradient. The extrapolation of the linear fit to intersect the disk and sky levels amplifies the signal.
The part of the slope used in the e-fold measure, from the shelf to the 1/e level, is typically four arcsec wide, while the slope measure typically extrapolates the fitted line over a 7-arcsec interval. The higher sensitivity of the slope measure can be directly seen in Figure 7 where the two height measures are plotted on a limb image with visible fine structure.
All the data shown have been corrected for the solar P-angle and the position angles shown are thus zero at the actual solar north pole with increasing angles eastward from this. All our data sets show an increased height in the northern and southern polar regions and occasional bumps of increased height at the activity regions.
The magnitude of the variations ptp (peak to peak or pole to pole) is about 1600 Km (or two arcsec). According to the e-fold measure the height varies from about 4300-4400 Km to just below 6000 Km. The slope measure shows nearly the same peak-to-peak height variation, but the average height varies between the different days. The rms scatter of the small-scale variations is typically 500 Km for the e-fold measure and 1000 Km for the slope measure.
Variations of the limb profile cause more variation in the average slope than in the e-fold measure. We tested this by measuring the same image before and after a digital smoothing, simulating different angular resolutions or different slopes of the limb profile. For the test image the slope measure showed a lower value than the e-fold measure before the smoothing, but the opposite afterwards. The difference was about 1000 Km for a Gaussian smoothing kernel of four arcsec (FWHM).
In the present data the discrepancy between the e-fold measure and the slope measure is largest for 5 July 1995, where the average levels differ by as much as 1000 Km (Figures 8a and 8b). The difference is caused by the unfortunate use of a prefilter that was asymmetric about H-alpha and reduced light levels and contrast. It is comforting that the largest pole-equator variation is found on the best sets of data.
The off-band data are plotted with the on-band data in Figures 8a and 8b (the diamond plot). They show a similar height variation around the limb as do the on-band data, with increased height at the poles. The amplitude of the variation is however only about half what we measure on-band (e-fold measure).
The e-fold measure gives a lower value off-band than on-band, since the off-band profile is steeper than the on-band profile. Although this indicates that the chromosphere is lower off-band than on-band, it is also an effect of the increasing gradient of the off-band profile toward the photosphere because of the bright 'horns' (Figure 2).
The slope measure gives a much higher value for the off-band data since it is defined using the disk brightness, which is much brighter off-band. The same gradient will thus give a much higher slope measure off-band than on-band. Off-band data shown in Figure 8b have been divided by two to fit the diagram.
Both the e-fold and the slope measure are, however, intended for measurements of the relative height around the limb and they cannot be directly used to compare the height difference between the on-band and off-band chromosphere. This has to be done by comparing the actual limb profiles, as is discussed in section 2 and shown in Figure 3.
We discussed the measurements of relative heights on-band and off-band in section 2. While the spicule (off-band) brightness initially falls off much more steeply than that in the general chromosphere (centerline), the off-band slope flattens at greater heights and Figure 3 shows only about a 500-Km overall height difference. Figure 8a shows the e-folding height of the spicules to be everywhere lower than the chromosphere by an amount ranging from 1 to 2.5 arcsec. Lippincott (1957) comments on the presence of low spicules seen against the chromosphere in Dunn's images (Dunn 1960).
The absence of a shelf in the off-band limb profile testifies to the fact that the chromosphere is optically thin at that wavelength, i.e., the spicules do not form an opaque band. Therefore, the anomalous height of the chromosphere cannot be attributed to spicules. Despite this fact, the off-band spicules are twice as bright as the centerline chromosphere. This is probably due to their excitation by the bright off-band photospheric flux.
We have described the method of spicule counting in section 4.5. The number of counted spicules extending more than 7000 Km from the photosphere is seen to increase from equator to pole in all our scans (Figure 9). In our scan from 1 August 1994 we counted up to 20 macrospicules per 150 arcsec at the poles, but only a few or none at the equator. We believe this is responsible for the result of Lippincott (1957) who measured individual spicules and therefore would have gotten the difference between the macrospicules at the pole and the ordinary chromosphere at the equator. We also see a tendency for the overall frequency of macrospicules to decrease when we approach the sunspot minimum, going from 1 August 1994 to 7 September 1995. We do not know if this is a true effect, but will monitor it in the future.
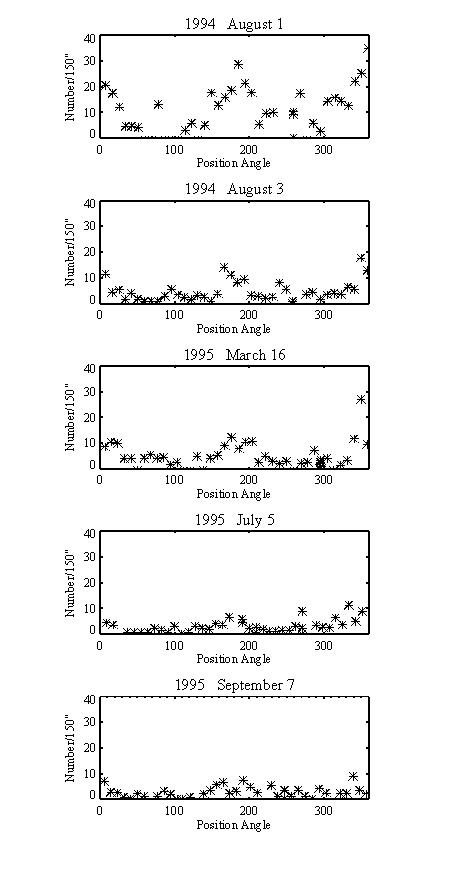
Fig. 9. The frequency of macrospicules reaching higher than 7000 Km as a function of position angle. The counted numbers are normalized to 150 arcsec intervals.
The increased number of macrospicules at the limb and the enhanced height of the general chromosphere can also be directly seen in Figure 10, which shows a polar and an equatorial image side by side from the 1 August 1994 scan.
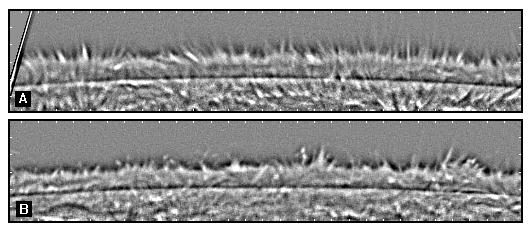
Fig. 10. High pass filtered centerline images from the 1 August 1994 scan to show the increased number of high spicules and the enhanced chromospheric height at the poles. The image pair shows sections of the limb at the pole (a) and at a lower latitude (b). Ticks are separated by 5 arcsec.
Designing a test to check the accuracy of the automatic limb-finding algorithm is hard, but the repeatability was checked since we had some images showing the same limb section at different times. We estimated the error in those measurements by comparing the average chromospheric height according to the e-fold measure for the two images. The height differed by 0.2 pixels (or 0.06 arcsec). This is much smaller than the real rms variation of the chromospheric height within a single image. The latter is about 0.7 arcsec for the e-fold measure, and 1.4 arcsec in the slope measure because of fine structure.
Occasionally the automatic routine finds the wrong edges and therefore produces totally wrong results. As mentioned above, we thus have more trust in the results of our interactive technique.
The interactive routine was tested by comparing several different user inputs for the same images. They resulted in an rms difference in measured e-fold height of 0.17 arcsec, which is higher than the error estimate for the automatic routine, but still much lower than the real solar scatter within a single image. It is below 10% of the measured signals. With this technique we see no occasional large errors except if the seeing is worsening, in which case we do not use the images.
We have also checked the software for systematic calculation errors by making a set of test images. These were prepared by taking one image from the 1 August 1994 scan and then rotating that in steps of 90 degrees. By rotating only in steps of 90 degrees we avoid errors introduced by pixel value interpolation. The limb was then detected in the first image and the resulting coordinates rotated and supplied to the program as identical limb fits for the other images. This is thus not to test the limb-fitting scheme, but rather to test the programs using the limb fit.
The height measurements were identical for the different rotations of the same image, showing that the programs are working correctly. Furthermore, the different averaging schemes, the median of the heights measured for the different radial tracings and the heights measured from the azimuthally averaged profile, showed the same result within 0.05 arcsec. We thus conclude that no systematic errors due to the programs affect the results. The main error source is instead the detection of the photospheric limb.
To compensate for the stray light during our height measurements we subtracted the stray light level as measured outside the chromosphere in the individual limb images.
The uncertainties in the spicule counts are due to subjective judgement: how bright the feature must be to be considered a spicule or if the observed feature is a spicule or part of another structure such as a small prominence. We have estimated this error by letting several different persons count the spicules in the same data set. The result is an rms error of 2-3 counts that we take as the uncertainty of the counted number of spicules.
The peak of chromospheric height and of macrospicule counts at the pole may be due to the presence of open field lines or may be a permanent feature of the poles (although Fracastoro's data supports the former). We have compared our height measurements with the location of coronal holes reported by Yohkoh SXT data. In the X-ray images the coronal holes are recognized as areas with little or no X-ray emission.
In Figure 11 we show our e-fold measure of chromospheric height (dashed line) along with the X-ray brightness (solid line) just inside the limb. The X-ray data, generally obtained within 10 hours of the H-alpha, is shown on an inverted scale to ease comparison with the height measurements. A coronal hole thus shows up as a high peak in the diagrams, and we clearly see that the variations of the height of the chromosphere are closely anticorrelated with the location and intensity of polar coronal holes. Whenever the X-ray brightness decreases at the poles, we see an increase in height of the chromosphere and frequency of macrospicules. (Spicule counts are plotted separately in Figure 9.) The trend is, however, broken in active regions where the X-ray is bright and the chromospheric height is usually, but not always, enhanced.
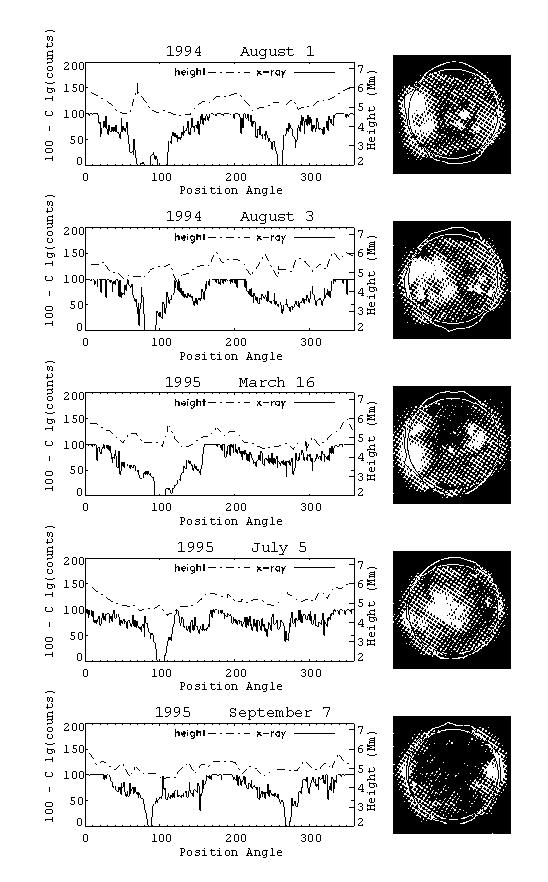
Fig. 11. The chromospheric height (in Mm) as given by the e-fold measure (dash-dotted line) together with Yohkoh SXT X-ray emission measured just inside the limb (solid line). The X-ray emission is shown on an inverted scale to emphasize the correspondence between dark coronal holes and increased chromospheric height. The scales for the X-ray (height) measurements are shown to the left (right). At right we display the corresponding Yohkoh images with the chromospheric height plotted around the limb.
The correspondence between a high chromosphere and a dark X-ray corona is especially clear in the data from 5 July 1995, when the X-ray image was exposed only two hours after the H-alpha images. In this data set we see a clean height variation around the limb, which follows the X-ray profile very closely. A few details may be noted. At 170 degrees position angle a step is seen in the X-ray brightness, which is closely followed by a similar feature in the height curve. At 100, 270, and 320 degrees position angles we see increased chromospheric height at the locations of enhanced X-ray brightness, due to active regions. Also in the other sets we see correspondence between active regions and enhanced chromospheric height. Clear examples are found at 70 and 280 degrees in the set from 1 August 1994, and at 115 and 305 degrees in the 16 March 1995 set.
It is fascinating that these results confirm the early Arcetri results of Fracastoro (1948), who found not only a polar height increase at sunspot minimum, but a disappearance of the effect as the solar cycle peaks. The latter would be expected if the cause is the disappearance of the coronal holes that takes place as activity picks up. Then the peaks in chromosphere and macrospicules are connected to open field lines. However, it is possible that the rise in activity raises the level of the apparent chromosphere in the equatorial regions. This might lead to a generally higher average chromospheric height at solar maxima, whereas the disappearance of the coronal holes would give an average lower height.
Along with microwave brightening (Kosugi et al. 1986), the two effects noted here are, to our knowledge, the only intrinsic chromospheric properties associated with the magnetic circumstances that give rise to coronal holes. By contrast, the helium holes associated with the coronal holes are produced by the decrease of XUV flux when the corona is weak.
The height of the H-alpha chromosphere, as measured by the e-fold and the slope measures, varies around the limb with an amplitude of 1600 Km ptp on-band and about half this amount off-band (H-alpha-0.7A). The more stable of them, the e-fold measure, gives a height of 4300-4400 Km away from the poles and outside active regions, which typically increases to just below 6000 Km at the poles with a real scatter of 500 Km (rms).
The polar height excess is co-spatial with the polar coronal holes, strongly suggesting a magnetic cause. Excess outside the polar regions is found within active regions. The frequency of macrospicules reaching 7000 Km is higher in the polar coronal holes than outside. We count as many as 20 per 150-arcsec limb within holes and only a few or none outside the holes. Since both poles had coronal holes during our observations, we cannot state the polar chromospheric properties absent a coronal hole.
The height of the chromosphere is lower in the spicule-dominated wings of H-alpha than centerline. While the spicule (off-band) brightness initially falls off much more steeply than that the general chromosphere (centerline), the off-band slope flattens at greater heights and Figure 3 shows only about a 500-Km (0.7 arcsec) overall height difference.
We would like to thank the staff at Big Bear Solar Observatory for their support, especially Randy Fear. We also want to thank Vincent Pery and Hans-Michael Hauser, summer students from the Ecole Centrale, Paris, who worked with an earlier data set during the summer of 1994. This work was supported by NASA Grant NAGW-1972, ONR Grant N00014-89-J-1069, and NSF Grant ATM-9320822. The solar X-ray images are from the Yohkoh mission of ISAS, Japan. The X-ray telescope was prepared by the Lockheed Palo Alto Research Laboratory, the National Astronomical Observatory of Japan, and the University of Tokyo with the support of NASA and ISAS.