| Research Note: Correlation Scale of Energy Containing Structures in the Base of Coronal Holes | Read More ... |
An essential parameter for models of coronal heating and fast solar wind acceleration that relay on the dissipation of MHD turbulence is the characteristic energy-containing length, , of the squared velocity and magnetic field fluctuations, u2 and b2, transverse to the mean magnetic field inside a coronal hole (CH) at the base of the corona. The characteristic length scale defines directly the heating rate of the solar wind (Zank et al. 2012). The goal of this study is to evaluate from observations of solar granulation and magnetic fields inside equatorial coronal holes.
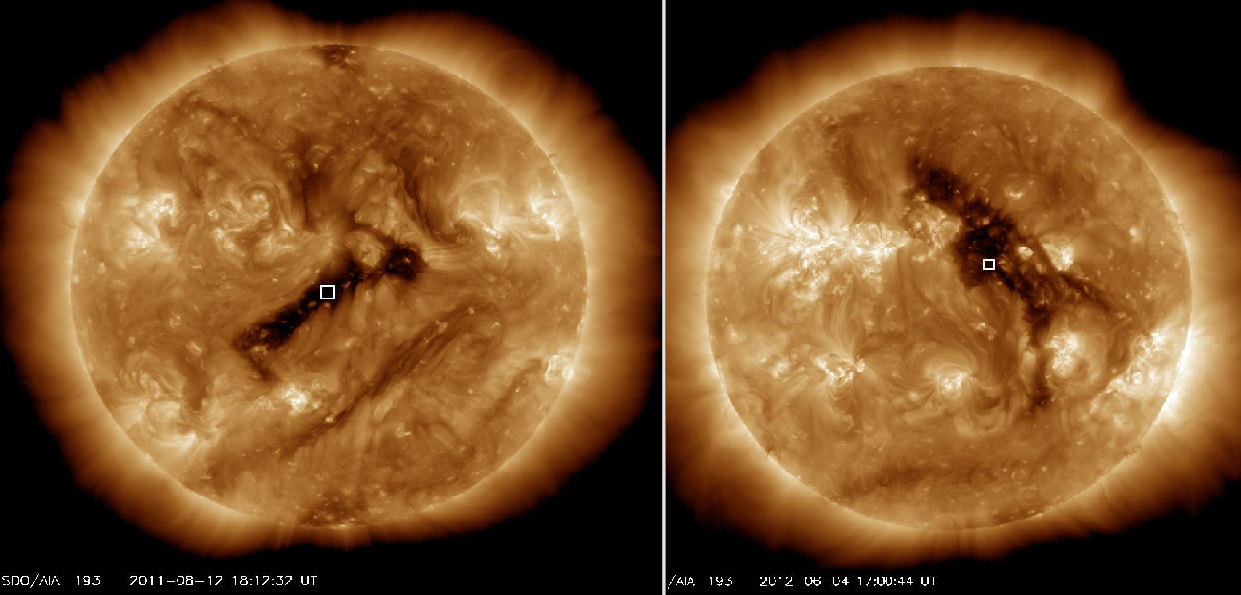
We explore two CHs (Figure 1 on the left, the FOV/NST is marked with boxes) for which New Solar Telescope (NST) time series were observed. Both CHs were observed at the times of their crossing the central meridian. The first CH was observed on 2011 August 12, and it is referred to hereafter as CH 2011-08-12. The second CH was observed on 2012 June 4 and is referred to hereafter as CH 2012-06-04.
The solar granulation data were acquired with NST with a broad-band TiO filter centered at 705.7 nm with a band-pass of 1 nm, which allows us to register the solar continuum intensity at this wavelength. The pixel scale of the PCO.2000 camera, 0.0375", is 2.9 times smaller than the telescope diffraction limit of 77 km. KISIP software package for speckle interferometry (Woger and von der Luhe 2007) was utilized to achieve diffraction limited resolution in the reconstructed images. The final CH 2011-08-12 (CH 2012-06-04) data set consists of 82 (659) speckle-reconstructed, aligned and destretched images. The final time cadence was 12 and 13 s, respectively.
Spatial fluctuations of the transverse component of the magnetic field inside a CH are of primary interest in this study. A unique data set for transverse magnetic fields in a large quiet sun area obtained with the Solar Optical Telescope/Spectro-Polarimeter (SOT/SP) aboard Hinode spacecraft on 2007 March 10 was kindly provided to us by Dr. B. Lites to analyze the squared transverse magnetic field fluctuations, . The maps of the magnetic field components are shown in their Figure 2 in Lites et al. (2008). We consider the data set as the primary source for deriving the characteristic length of the transverse magnetic fluctuations. For comparison, we also calculated the proxies for the characteristic length scale (see definitions below), , , and from the LOS component,
Our main goal is to find, following Batchelor (1953), "convenient measures of the linear extent of the region within which velocities [as well as squared velocities and magnetic field] are appreciably correlated". We will use three different approaches for deriving the characteristic length from the correlation function, . The first approach is to determine the Batchelor integral scale
. (1)
We adopted to be 5 Mm to exclude the non-diminishing tail caused by noise. The second method is to approximate the correlation function near the origin (Hinze 1958, Monin and Yaglom 1975, Feder 1989):
. (2)
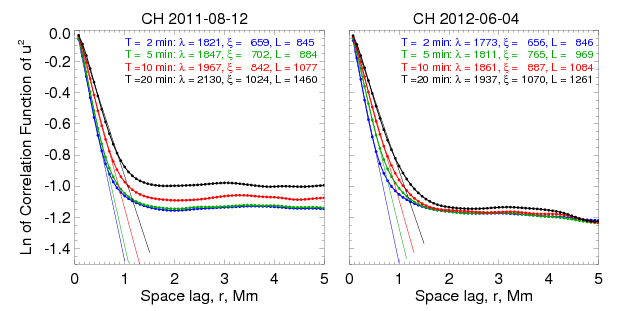
When is fitted with an exponential function, the correlation function drops by times at a scale . This scale is called the correlation length in the percolation (Feder 1989) and in second-order phase transitions theories. Finally, the characteristic length can also be determined via the -folding scale of without any approximation of the latter (the scale, where the measured correlation function drops by times). We denote this measure as . The parameters introduced above, , , and , are considered as proxies for the characteristic length, and are calculated for all data sets.
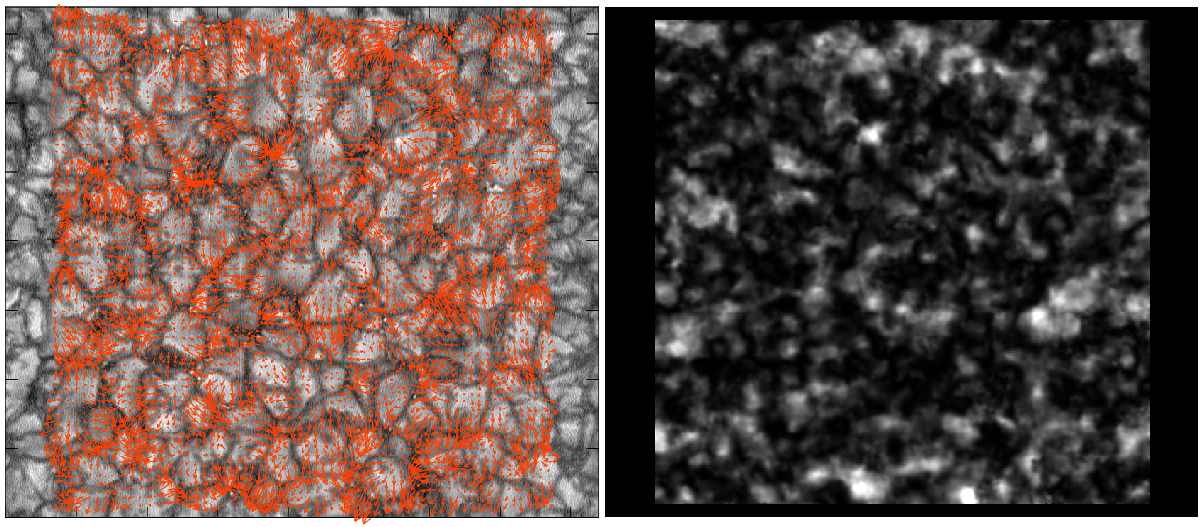
We first focus on the statistical properties of the squared amplitude, , of the -vector, which is a positive scalar that characterizes the kinetic energy of photospheric random motions driven by convection and turbulence. Therefore, the -maps represent an entity in which we are interested (see Eqs. 2-6 in Zank et al. (2012). In the right panel of Figure 2, we show an -map calculated from the flow map shown in the left panel. Patches of enhanced kinetic energy (white areas) are intermittent with dark voids. Our aim is to estimate the characteristic length of these patches. We find that for -structures, Batchelor integral scale, , varies in a range of 1800 - 2100 km, whereas the correlation length, , and the -folding length, , vary between 660 and 1460 km.
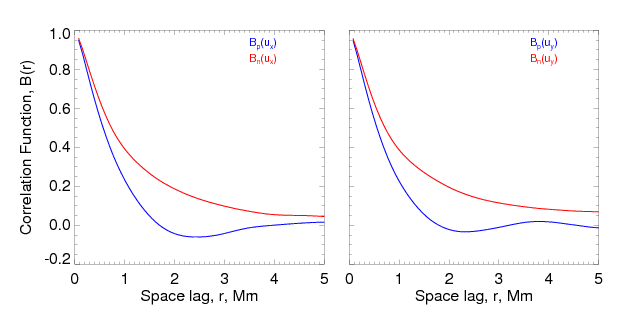
We then calculated correlation functions of the transverse velocity components, and . For a 2D vector field (unlike a scalar field), one has to compute two correlation functions (Batchelor 1953): one of them, , is parallel to the separation vector , and the other one, , is normal to . To simplify the calculations without sacrificing the quality, we computed assuming that varies along the -axis only. was computed with varying along the -axis.
We find that the behavior of the parallel and normal correlation functions is different (see Figure 4). Whereas the normal correlation function, , is positive for all scales, the parallel function changes sign, being always situated below the normal correlation function; i.e., . This situation holds for all the analyzed data sets and for both velocity components, and . On average, the parallel correlation function has a characteristic length of 803±157 km, whereas the characteristic length derived from the normal correlation function is 1307±278 km. Note that in the case of homogeneous isotropic hydro-dynamical turbulence, the mutual behavior of the parallel and normal correlation functions of velocity fluctuations is expected to be quite the opposite, i.e., the parallel correlation function exceeds the normal correlation function at all scales : (Batchelor 1953, Monin and Yaglom 1975). Obviously, the condition of homogeneous isotropic turbulence is not met in the solar photosphere. Moreover, the presence of magnetic fields could also contribute in the observed peculiar relationship between the correlation functions.
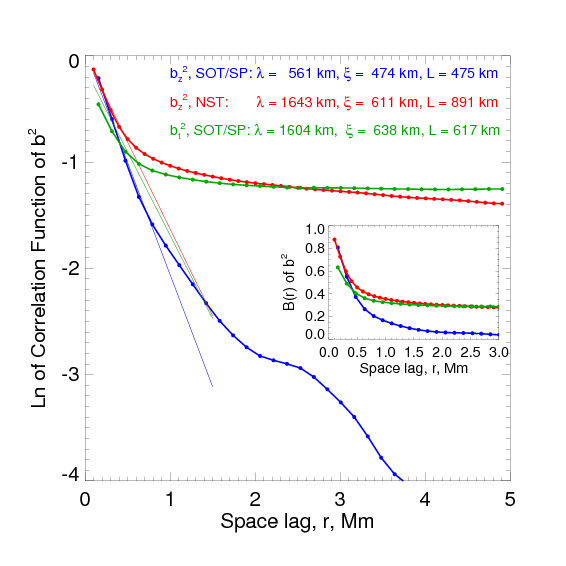
The correlation functions from the squared magnetic field components are shown in Figure 5. The most interesting to us is the correlation function of the squared transverse magnetic field component, , plotted with the green line. On scales below approximately 0.5 Mm, the three correlation functions are similar. On larger scales, the NST function (red line) agrees well with that derived from . It is plausible that the very low noise level in the data (about 2-3 Gauss, Lites et al. 2008) is the reason why on scales larger than 1 Mm the blue curve in Figure 5 is much lower than the green and red curves. Thus, the correlation functions from the squared LOS component of the magnetic field can be used as an appropriate proxy to estimate the the correlation function of the squared transverse component. The characteristic length of the squared transverse magnetic field fluctuations varies in a range of 617 - 1600 km with an average value of 950±560 km.
Preliminary outcome
The characteristic lengths of the energy containing structures, and , were derived from correlation functions of and by using three independent methods. These were calculated from the Batchelor integral scale , the correlation length, , and the -folding length, . The averaged (over , , and ) characteristic scale for the -fluctuations is 1260±500 km, and that for is 950±560 km. The characteristic length derived from squared velocity fluctuations exceeds that derived from the squared transverse magnetic field fluctuations by 20 - 70%.
Thus, the characteristic length of the energy-containing structures in the photosphere lies in the range of 600-2000~km, which is on average an order of magnitude lower than the values used currently in models (Matthaeus et al. 1999, Dmitruk et al. 2001). Taking into account that the nonlinear dissipation terms in the MHD equations (Eq.(1) in Zank et al. (2012), is inversely proportional to the correlation length of energy containing structures at the base of the corona (see Eq.16 in Zank et al. 2012), these results play a critical role in determining the effectiveness of the coronal turbulence transport models in heating the solar corona and hence in driving the solar wind.
It is worthy to note that obtained estimates of the averaged transverse velocity (about 1.2 km/s) and the characteristic length scale for -fluctuations (about 1300 km), combined with the results of Rudiger, Kitchatinov and Brandenburg (2011) allow us to evaluate the turbulent magnetic diffusivity and cross-helicity in the photosphere. Indeed, when the above estimates are used in the expression for turbulent magnetic diffusivity , it gives us . In turn, the cross-helicity, according to Eqs. 19,24 in Rudiger, Kitchatinov and Brandenburg (2011), is in direct proportion with . This allows us to conclude that the magnitude of the cross-helicity (1 G km s) obtained by Rudiger, Kitchatinov and Brandenburg (2011) with , might be at least five times larger.
