Magnetic field based measurements of the solar rotation rate at the solar poles will be presented. These results have been obtained using the BBSO video magnetograph and analyzed using local correlation tracking of the magnetic field knots which make up the overall polar fields. The measurements are from the period 1995 to 1999 and cover the early rising phase of Cycle 23 and latitudes from 45 to nearly 90 degrees. Measurements based on time series mosaics (time resolution ~25 minutes, duration one day) as well as twice-daily images will be presented. Comparison will be made to the results of Snodgrass (1983).
For a long time the high resolution and sensitivity of the BBSO magnetograph has suggested the possibility of measuring solar rotation near the extreme poles of the Sun. Most observations of rotation rates have been limited to latitudes below around 70°, or may have one resolution element in latitude that covers, say, the area between 65° and 85°. The objective here is to go beyond this and approach the extreme solar poles using the high-resolution magnetograms obtainable at BBSO.
A previous attempt (Varsik, Wilson, and Li 1999) has been made, but the limitations of the approach used were clear at the time. The Varsik, Wilson, and Li paper tracked by hand recognizable magnetic knots (the strong magnetic features seen at apparent supergranule boundaries) over time periods of about 7 hours. It became clear that a more automated procedure would have to be found to make further work practical. For this work the method of local correlation tracking (LCT) was investigated.
To test the LCT method three different types of data were used, representing the types of polar observations that have been done in recent years at BBSO. The first data set, representing current BBSO practice, was obtained 1999 February 23. It consists of 9 mosaics of 5 images each, obtained at about a 25-minute cadence. This data set also included video magnetograph (VMG) flatfield images obtained using the method developed by Jongchul Chae based on the Kuhn, Lin, and Loranz (1991) method.
The second data set included data from all-day observations of the south pole obtained 1996 March 10. In these data, only a single position was observed for a nearly 9 hour period, with about a 30-minute time resolution.
The third data set included two mosaics obtained 1995 June 22. These were some of the same mosaics used in the Varsik, Wilson, and Li paper measurements with manual feature tracking. These mosaics were taken in the morning and afternoon, and were about 7 hours apart.
All images were obtained using the the BBSO video magnetograph (for further description see Varsik 1995) and the 25-cm refractor. The only instrumental difference was that the 1995 and 1996 data used a KDP 1/4-wave polarization modulator, while the 1999 data used a liquid crystal 1/2-wave modulator plus a fixed 1/4-wave plate.

The first (1999) data set included VMG flatfield frames obtained using an implementation of the Kuhn, Lin, and Loranz method. This removes background non-uniformities far better than earlier methods. For the other two data sets intensity flat field frames were constructed by taking disk-center quiet Sun frames obtained the same day and smoothing them. Background non-uniformities in the magnetic field images were removed by a high-pass filter as in previous work. In the 1999 and 1995 data sets mosaics were constructed using a cross-correlation alignment procedure.
Limb fitting was done using the intensity images obtained at the same time as the magnetograms. The position of the limb was used to correct the image scale and to correct for errors in the telescope guider system.
In order to remove noise and isolate the magnetic features from the background, a further cleanup procedure was done. This basically first set all features with magnetic field strength (absolute value) greater than 30 gauss to 0. The standard deviation of the remaining image was used as an estimate of the noise level in the image. This is not strictly correct since there are many weaker real features in the magnetograms, but it was felt that it was best to use the strongest features present for tracking. Once the standard deviation was obtained, points with magnetic field strengths less than 3 X the standard deviation were set to 0. Finally,the magnetic field values were corrected for projection by multiplying by sec(ρ) (where ρ is the angular distance from disk center).

After mapping the images to Cartesian coordinates, a local correlation tracking algorithm (generously provided by Louis Strous of LMSAL) was used to obtain the shifts of the magnetic features with time. A 2 X 2 degree grid of points was used.


The uncertainty in measuring the rotation rate near the solar poles is of course strongly affected by the location the solar pole is observed from. The solar pole is never tipped more than about 7° from the limb. Clearly the determination of the position of the limb, and thus the coordinate system in an image, is most important. A second effect at least as important is the convergence of the meridians of longitude at the pole. This causes any rotation at the pole to be very small in terms of a physical shift of rotation tracers.
A rough approximation of the uncertainty in the longitudes obtained from the remapping can be found by using the correlation shifts measured in the meridional direction. Here we will use offsets from center Sun along the heliographic meridional direction (y') and perpendicular to the meridional direction (x'). These are related to the geocentric offsets by rotation by the position angle P. These should essentially reflect measurement errors since any true meridional flow is much smaller than the rotational velocities we are trying to measure. By taking the smoothed absolute value of the meridional shifts and rescaling it by a factor based on the ratio of the partial derivative of the longitude with respect to y', we can obtain a rough estimate of the uncertainty in the longitudes and thus in the measured rotation velocities. Note that for simplicity we allow B0 = 0 in computing these ratios. After the ratio is computed, the ratio value to be applied is shifted by the appropriate B0 angle. Test calculations suggest that the dependence on the uncertainty in the longitude on y' is much stronger than that on x' for latitudes very close to the pole. Also, if the value of this ratio is less than 1, which it is for latitudes of lower than around 70°, the value 1 will be used. In this case the contribution of the uncertainty in x' is greater than that of the uncertainty in y'.
There is an additional contribution for the data set from 1996 March 10.


The most effective means of reducing background variations in the magnetograms has been found to be the use of flat field frames. The earlier data, with no flat fields available, always has some residual variation.
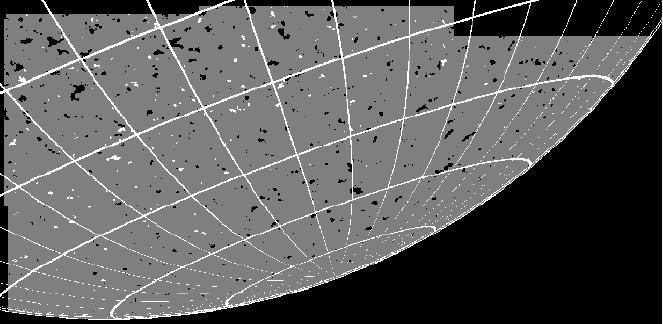
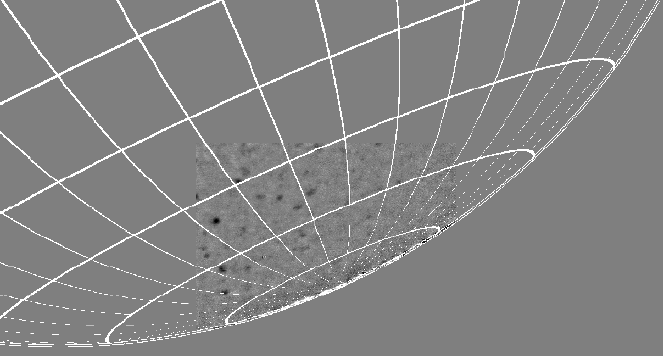
The main effect of seeing on these measurements is a reduction in the sensitivity of the instrument, reducing the number of features which can be measured using cross-correlation. This can be seen, for example, by comparing Figure 1 and Figure 5.
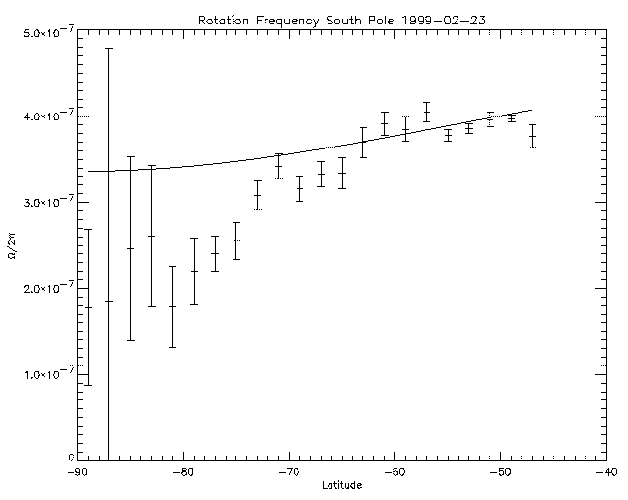
Recent data (see Figure 4) using the latest technique, show interesting results. The lower (below 60°) latitude rotation follows the Snodgrass (1983) curve well. Note that this plot is based on a single 3.3-hour run. The high-latitude region above 70° shows a significant departure from the Snodgrass curve which probably would not have been observable in the Mt. Wilson data set. The uncertainty in the rotation rate increase as expected for the extreme (beyond 80°) polar region.
Attempts to apply the procedures described here to earlier BBSO data sets have not been successful so far. The BBSO log books show two types of polar observations in the past. The first and by far most frequent was a series of magnetograms taken at a single position for a whole observing day (7-8 hours). These cover only approximately 300 X 225 arcseconds. No flat field frames were obtained, although often an intensity flatfield can be synthesized using disk-center quiet Sun intensity images. A vector plot of the data from such a run on 1996 March 10 is shown, along with the corresponding latitude-averaged rotation rate plot. A serious problem with this type of data set is that the small portion of the solar limb in the image reduces the quality of the limb fit possible. Therefore the velocity uncertainty as estimated from the meridional motions is much larger than for a mosaic time series.
The second and rarer type of observation at BBSO is a mosaic of images at the start and end of an observing day. This is the type of data analyzed in Varsik, Wilson, and Li. An attempt was made to use LCT on the data from 1995 June 22, one of the days discussed in the earlier work. The shift and change in appearance of the magnetic features over a 7-hour period was enough to confuse the LCT algorithm, and no feature shifts were successfully measured using LCT.
The results shown here indicate that LCT can be used to obtain rotation rates closer to the pole than other methods, if the data set has the right properties. The 1999 February results indicate that beyond -70° latitude the rotation rate of magnetic features appears significantly slower than the Snodgrass rotation law. Beyond -80° the uncertainty is still such that no significant measurements can be made. This decline of the rotation rate is not expected, since the existence of the poleward meridional flow seems to require the opposite (a speed-up of rotation close to the pole) to occur. This polar vortex, suspected by many observers, is not clearly observed, but of course may lie between -80° and -90°. The data for 1999 February 23 do suggest that at least the rotation rate stops decreasing between -81° and -85°.
It is possible that feature tracking algorithms may be able to resolve rotation closer to the pole, and may make it possible to analyze some existing BBSO data, particularly the data sets containing polar mosaics. The impending reversal of the polar fields should provide interesting future results using the current method.
The problem of fitting the correct limb position requires that a mosaic of multiple magnetogram images be used, while the observed changes in the magnetic field elements and the observed amount of shift in the features require that many short time intervals (~25 minutes) be measured when LCT is used to look for solar rotation.
I would like to acknowledge the help of Louis Strous at Lockheed in providing the LCT software, and Carsten Denker for his assistance in converting the software from ANA to IDL. Jongchul Chae has generously made his magnetogram flatfielding software available.
I would also like to thank the BBSO observers for continuing the polar observation program.
Kuhn, J. R., Lin, H., and Loranz, D.: 1991, PASP, 103, 1097.
Snodgrass, H. B.: 1983, Astrophys. J., 270, 288.
Varsik, J. R.: 1995, Solar Physics, 161, 207.
Varsik, J. R., Wilson, P. R. and Li, Y.: 1999, Solar Physics, 184, 223.