
|
May 13 2005 M8.0 Flare, CME and Geomagnetic Storm |
The
May 13 flare (see
more info about the flare here) occurred
in an active region NOAA 0759 at N10E10 with relatively simple
magnetic topology. The position, magnetic structure and polarity
distribution in this active region are very similar to these of the
SHINE
May 12, 1997 event.
The May 13 2005 AR had one large well developed sunspot and several
small sunspots with partially developed penumbra. The magnetic
structure could be described as bipolar with several strong magnetic
flux concentrations. A
prelimenary
analysis
of the May 13 2005 flare and CME was presented in a poster at 2005
Fall AGU meeting in San Francisco, CA.
A PDF copy of an accepted that describes this event is available here
BBSO completely covered this flare and the following 1 min cadence data have been obtained:
1"/pix full disk Halpha images from Singer telescope;
0".6/pix hi-res Halpha images from 10" telescope;
0".6/pix Ca IIK hi res images from 10" telescope;
0".6/pix vector magnetograms from 10" telescope.
Please contact Vasyl Yurchyshyn for data availability
|
|
|
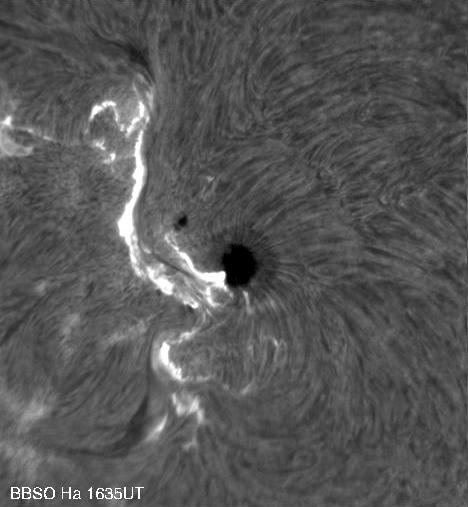
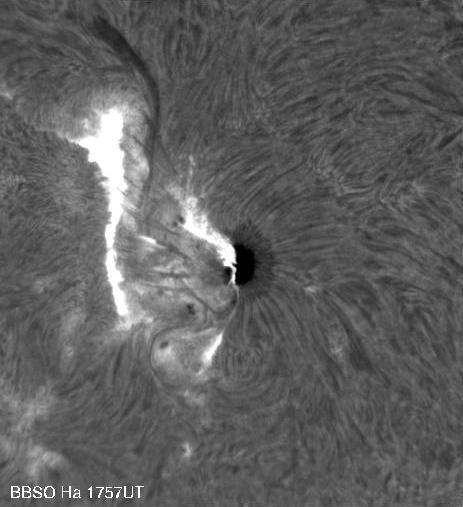
Ha images above show that the two ribbon flare was associated with the major neutral line (hi-res movies are available upon a request). We would like to note that a dark chromospheric filament above the neural line did not erupt and it was seen before, during and after the flare. Structure of Ha filaments as well as the orientation of the post-flare loop system shows that negative helicity (left handed twist) was dominant in this active region.
We modeled the active region's magnetic field with a linear force-free (LFFF) model with parameter alpha=-0.025 arcsec-1. Images below show magnetic force lines over plotted over Ha images and an MDI longitudinal magnetogram. The LFFF model adequately represents both post-flare loops system and the general twist in the active region, while, of course, many peculiarities in the observed field could not be modeled.
|
|
|
|
The averaged flow map shows that there was a persistent converging flow toward the major netral line associated with the flare. A DMG movie made of the line-of-sight component reveals that this converging motion was due to a strong moat outflow from the major spot. We speculate that the structure of the magnetic field above the neutral line could be represented by a sheared arcade and magnetic cancellation due to the converging flow could lead to a reconnection and the subsequent eruption. Thus, converging motion on the neutral line brought together green field lines and reconnection produced post-flare loop system (pink) and the large-scale magnetic field (yellow) that gave rise to a CME.
|
|
Unfortunately LASCO did not cover the event and only the first image of the CME is available. CME arrived at 1AU on early may 15 the and it had strong, negative and rotating Bz and positive By. Visual inspection of the preliminary ACE data reveals that the CME was observed at 1AU as a magnetic cloud and this magnetic cloud was left handed and its axial field pointed eastward, which corresponds to the helicity and the direction of the active region where it originated. Due to strong negative Bz, the CME on May 13 produced a strong geomagnetic storm, when the Dst index dropped to -260nT, which is 60 nT more than predicted.
(c) Last modified on Nov 13, 2006 by Vasyl Yurchyshyn