Recent
Talks, Posters, etc.
This work was supported, in
part, by NSF grants ATM-9903515, ATM-0205157, ATM-0076602 and
NASA(NAG5-9682) grants
Linear
Force-Free Field Modeling: Method
A
method for the reconstruction of the linear force-free magnetic field
in a bounded domain was elaborated. The methods allows to specify
boundary conditions not only on the "photospheric" level
but also on lateral parts of the volume. Dirichlet boundary value
problem for the Helmholtz equation is solved for B_z component
specified at the \Omega boundary. Chebyshev's iteration method with
the optimal rearrangement of the iteration parameters sequence was
used. The solution is obtained as for the positive-definite, so for
the non-sign-definite difference analogue of the differential
operator \nabla^2 u+\alpha^2 u. Specifying two scalar functions B_x
and B_y on the intersection of the lateral part of the \Omega
boundary with one selected plane z=const and using B_z inside the
\Omega, we have found B_x and B_y throughout the \Omega. The
algorithm was tested with the numerical procedure, which gives the
analytic solution B of the linear force-free field (LFFF) equations
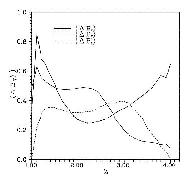
for the dipole in a half-space. The r.m.s. deviation of the analytic
solution B from the calculated B' does not exceed 1.0% (Figure 1).
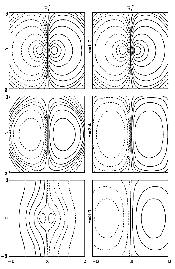
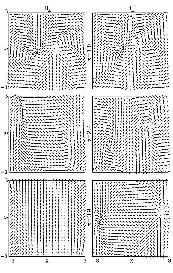
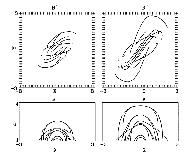
Comparison of B' with B'', which was calculated by the potential
non-photospheric boundary conditions, shown that they differ
significantly (Figure 2, 3, 4). Thus, specification
of boundary conditions at non-photospheric boundaries of the volume
is of particular importance when modeling the LFFF above an
active region.
|
|
|
|
|
|
Figure
1. Average over the entire horizontal plane of the integration
domain relative error of the numerical solution B' relative to
the analytic solution B as a function of z.
|
Figure
2. Contours of B_z component of magnetic field at different
heights. B' - linear force-free field with analytic force-free
boundary conditions and for B''- linear force-free field with
potential non-photospheric boundary conditions
|
Figure
3. Azimuth of the calculated magnetic field. See explanations on
Figure 2
|
Figure
4. Topview (top panel) and sideview (bottom panel )
of the lines of force of fields B' and B''
|
Linear
Force-Free Field Modeling: Application to AR 7216
The
new numerical code for the LFFF modeling in a bounded domain above an
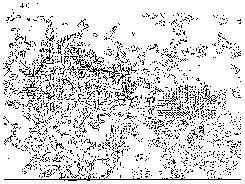
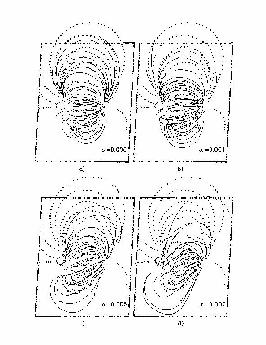
active region was applied here to the AR NOAA 7216 (Figure 5). The
code uses the B_z - component of the magnetic field at the
photosphere as main data and the information about coronal fields as
supplementary data. In the considered case of AR 7216 the
potentiality of external X-ray coronal loops was used. The potential
B_z substitution at the non-photospheric sides of the considered
volume as boundary conditions secured a good modeling of the coronal
field of the AR 7216. It has been shown that coronal magnetic field
of the AR 7216 4 July,1992 at about 00:29 UT was non-linear
force-free field with decreasing with high positive \alpha, slowly
turning into potential one at the height about 10^5 km
(differential shear) (Figure 6). Electric currents in coronal
loops were anti-parallel to the magnetic field, their density
decreased with height. The total coronal twisting of this large,
quiet, vortexless active region was weak (\alpha = 0.001,...,0.007
arcsec^-1), but the sense of twisting - right-hand - was nontypical
for active regions of the northern hemisphere.
|
|
|
|
|
Figure
5. Vector magnetogram of AR NOAA 7216. Solid lines - N polarity.
|
Figure
6. Comparison of observed SXT/YOHKOH X-ray loops (dots) and
calculated field lines with different alpha
|
|
Magnetic
Structure of an AR Filament
Investigations
of filaments both quite and active region is point of major interest
because they are connected with the CMEs and solar flares occurrence.
Central question of these studies is the inferring of the filament
magnetic field structure. It is not practical to measure the magnetic
field vector of an active region filament because most of them are
located too low in the corona for direct spectroscopic observations.
That is way any indirect inferences concerning the magnetic field
structure of an active region filament are interesting and useful for
theoretical considerations.
We report here on observations of the
active region NOAA 7597 in which the SN/C1.3 two-ribbon flare
occurred on Oct 16, 1993. After the two-ribbon flare started (0919
UT), evaporated chromospheric plasma filled numerous magnetic loops
(unvisible in H$_{\alpha}$ before the flare) that span the
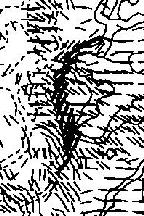
photospheric inversion line and the filament itself. Figure F1. shows
longitudinal magnetic field (northern polarity - solid contour),
orientation of the transverse magnetic field (short line segments)
and the location and the orientation of the fine structure of the
fileamnt (heavy short lines). By comparing the orientation of the
photospheric transverse magnetic field with that of chromospheric
fibrils (Figure F1) and soft X-Ray structure (Figure F4) one can see
that they significantly differ. Thus, the orientation of transverse
magnetic field are changed when we go from the photospheric to the
coronal level. It could be nothing surprising but such changes take
place in the volume occupied by the active region filament. The
observed discrepancy can help us to make a conclusion about possible
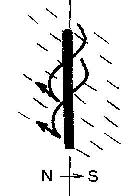
magnetic configuration of the observed filament. A possibile
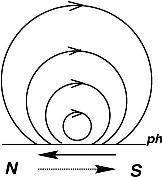
explanation is presented in Figure F2 and F3 and is based on the
inverse configuration model. Let us suppose that converging and
shearing flows bring together the magnetic loops footpoints and twist
the loops themseves at both sides of the photospheric inversion line.
Then the orientation of the transverse magnetic field above and
underneath the filament will be different as it follows from Figure
F3. The only thing one should keep in mind is, that in this case, any
method for resolving of the 180 degree ambiguity will give us normal
direction of the transverse field (Figure F2, dashed arrow) while the
real thansverse (to the neutral line) component of the magnetic field
of the filament at photospheric level pointed in S-N direction
(Figure F2, solid line). This can be important when study the the
flare activity (so called "bald patches"), the variation of
the magnetic shear (Robert Cameroon, private communication) and also
when processing the raw data of vector magnetic field.
|
|
|
|
|
Figure
F1. The map of vector magnetic field (image plane, N polarity --
solid line, short lines - denote transverse field) is overlapped
by the sketch of H\alpha loops (heavy lines)
|
Figure
F2. Cartoon of the possible magnetic configuration of the active
region filament: side view
|
|
|
|
|
|
|
Figure
F3. Cartoon of the possible magnetic configuration of the active
region filament: side view
|
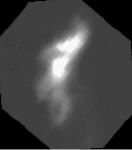
Figure
F4. The soft X-ray loops above the filament. The orientation of
the loops is similar to that of the fine strcuture of the H\alpha
filament
|
|
Current
Helicity Imbalance
It is
widely accepted that the energy source for non-stationary processes
in the solar corona is the magnetic field energy stored in the form
of electric currents. Since flares seemingly can occur in any active
region, the energy build up mechanism must be easy accessible for all
solar active regions. New conceptions of the magnetic energy build-up
based on helical nature of solar magnetic fields were proposed
recently. It has been shown that such non-stationary processes as
filament eruptions, coronal mass ejections and active region loop
expansions follow from the build-up of magnetic helicity in emerged
flux ropes and the current helicity is of particular importans in the
magnetic energy build-up. If we suggest that coronal fields evolve
through sequences of force-free states, the energy of small-scale
fluctuations of magnetic field and velocity, propagating upward from
the photosphere along the field, can be transferred to the
equilibrium magnetic field energy. This is equivalent to the
generation of an electromotive force parallel to the equilibrium
field (the alpha-effect). If the alpha-effect acts in some volume V,
then there is a predominant (over the volume V) sign of the
current helicity (see Figure 8) . The main purpose of the present
study is to check whether there is a predominant sign of the current
helicity at the photosphere of various active regions. The most
appropriate parameter for this should be the imbalance of the current
helicity over an active region. Is it has been inferred from
calculations in 90\% of cases the imbalance
\rho_h of current helicity h_c over an active region was quite
significant: only in 4 cases out of 40 studied the values
\rho_h were close to zero. Further, in 82.5\%
of cases the predominant current helicity was negative (\rho_h<0)
in the northern hemisphere and positive (\rho_h>0) in the southern
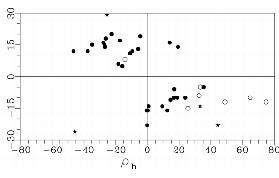
hemisphere. The distribution of imbalance of current helicity
in an AR versus latitude, is shown in Figure 7. The points are
located predominantly in the 2-nd and 4-th
quadrants. Unipolar spots (denoted by open circles) tend to
have a stronger imbalance of current helicity than other magnetic
structures at the same latitude; three of the four
\delta-configurations (denoted by star) have extremal locations on
the diagram, showing high values of \rho_h at high latitudes. Three
\delta-configurations obey sign rule, but one doesn't. In the
northern hemisphere two ARs do not obey sign rule.
|
|
|
Figure
7. Dependence of the current helicity imbalance (vertical) on
solar latitude (horizontal)
|
Sign-Singularity
of Current Helicity
Sign-singularity
of 2D structures of current helicity can be studied by introducing a
signed measure and by calculating some power-law exponent:
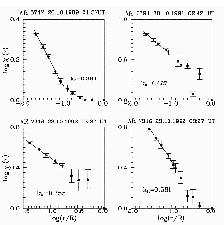
cancellation exponent \kappa. It has been recently shown that current
helicity (Figure 8) calculated using the photospheric magnetic field
vector measurements possesses a well pronounced scaling behavior. In
Figure 9 we show the results relative to the large bipolar active
region NOAA 7316. A nice sign--singularity is
present, with a well defined value of \kappa, in the region
between 10^4 Km up to the resolution limit of the measurements, say
about $10^3$ Km. There is a systematic tendency
for the cancelation exponent in the leading part of an AR to be
smaller than that in the following part. We think that such a
difference between \kappa in the leading and following part is caused
by the fact that the magnetic field of the leading spot, as a rule,
is more compact than that in the following part. This fact must be
reflected in the structure of h_c.
Well pronounced scaling laws
take place for 2D structures of current helicity in ARs, indicating
that the signed measure obtained with h_c is sign--singular, say the
cancellations follow a nontrivial anomalous scaling.
|
|
|
|
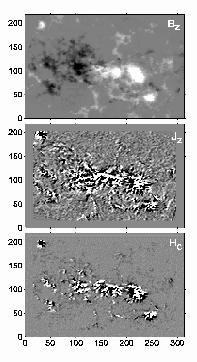
Figure
8. Top: Greyscale map of vertical magnetic field.Middle:
Greyscale map of vertical electric currents.Bottom:
Greyscale map of the photospheric current helicity
|
Figure
9. An example of sign-singularuty spectra. The slope of spectrum
defines the cancellation exponent
|
Variations
of Scaling Properties with Flaring
The
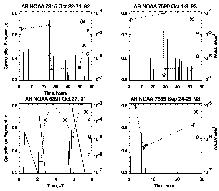
time variations of the cancellation exponent seem to be related to
flare activity of an active region: the periods of enhanced flaring
are accompanied by a drop and subsequent rise of the cancellation
exponent. Here we show the sesults of study the flare-related changes
of cancellation exponent on the basis of magnetic field observations
of five active regions. We have found that in two cases the
significant decrease of \kappa begins tens minutes (AR 7590 - 90 min;
AR 6891 - 30 min) before strong flare (X-ray class C and greater). In
AR 7315 decreasing took place at the time flare was in progress while
in AR 7585 it turned out impossible to outline time interval due to
significant gap in observations (about 3 hours between successive
magnetograms). The decrease of the cancellation exponent in flaring
active regions are greater then 30% while this decrease in case of
quite active region NOAA 7216 doesn't exceed 11%.
|

|
|
|
Figure
10. Top: An example of sign-singularity spectra. Bottom:
Variation of the cancellation exponent vs time in flareless
active region AR NOAA 7216
|
Figure
11. Variation of the cancellation exponent vs time in four active
regions (dashed line, asterisks). Vertical picks represent
location in time and X-ray of observed flares
|
We
suggest that the reduce of the \kappa indicates changes in the
transverse magnetic field structure linked with solar flare.
Variation of \kappa also assumes re-structuring of the current
helicity or/and reorganization of the current system. The wide range
of vortexes should dissipate over whole AR as flare is in progress
(at least, \kappa defines the vortex behaveour at scales 1500 - 15000
km). It has also been found that at flaring periods a significant
increasing of the current helicity imbalance took place which might
imply a total reinforcement of twisting of a whole magnetic
configuration.
|
|
|
|
|
Figure
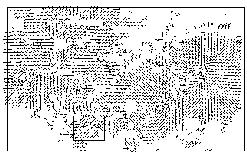
12. AR NOAA 7315.Azimuth of transverse magnetic field before
flare (thin line segments) and after (thin line
segments)
|
Figure
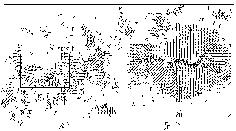
13. AR NOAA 7590. Azimuth of transverse magnetic field before
flare (thin line segments) and after (thin line
segments)
|
|
|
|
|
|
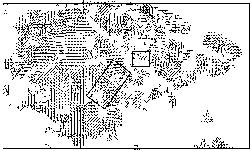
Figure
14. AR NOAA 6891. Azimuth of transverse magnetic field before
flare (thin line segments) and after (thin line
segments)
|
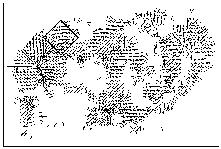
Figure
15. AR NOAA 7585. Azimuth of transverse magnetic field before
flare (thin line segments) and after (thin line
segments)
|


